Infographic: Reported health conditions
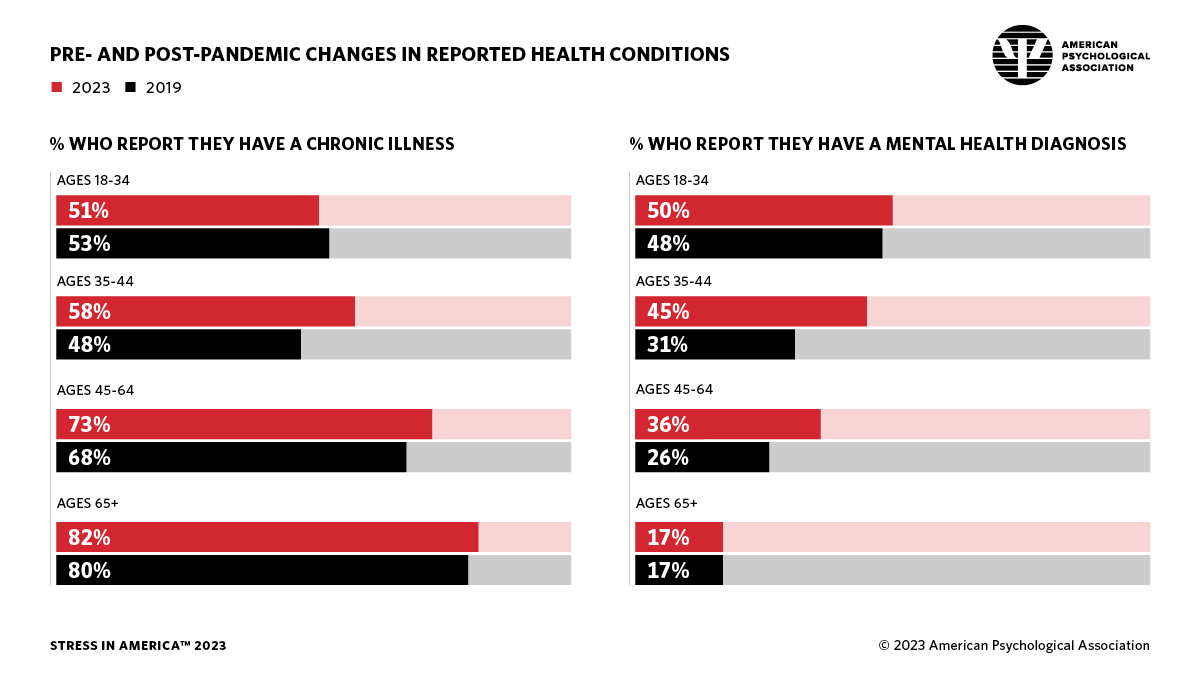
Details of infographic from APA’s October 2023 Stress in America survey
Pre- and post-pandemic changes in reported health conditions
Percentage who report they have a chronic illness
Ages 18–34
- 2023: 51%
- 2019: 53%
Ages 35–44
- 2023: 58%
- 2019: 48%
Ages 45–64
- 2023: 73%
- 2019: 68%
Ages 65+
- 2023: 82%
- 2019: 80%
Percentage who report they have a mental health diagnosis
Ages 18–34
- 2023: 50%
- 2019: 48%
Ages 35–44
- 2023: 45%
- 2019: 31%
Ages 45–64
- 2023: 36%
- 2019: 26%
Ages 65+
- 2023: 17%
- 2019: 17%