Infographic: Stress level by household status
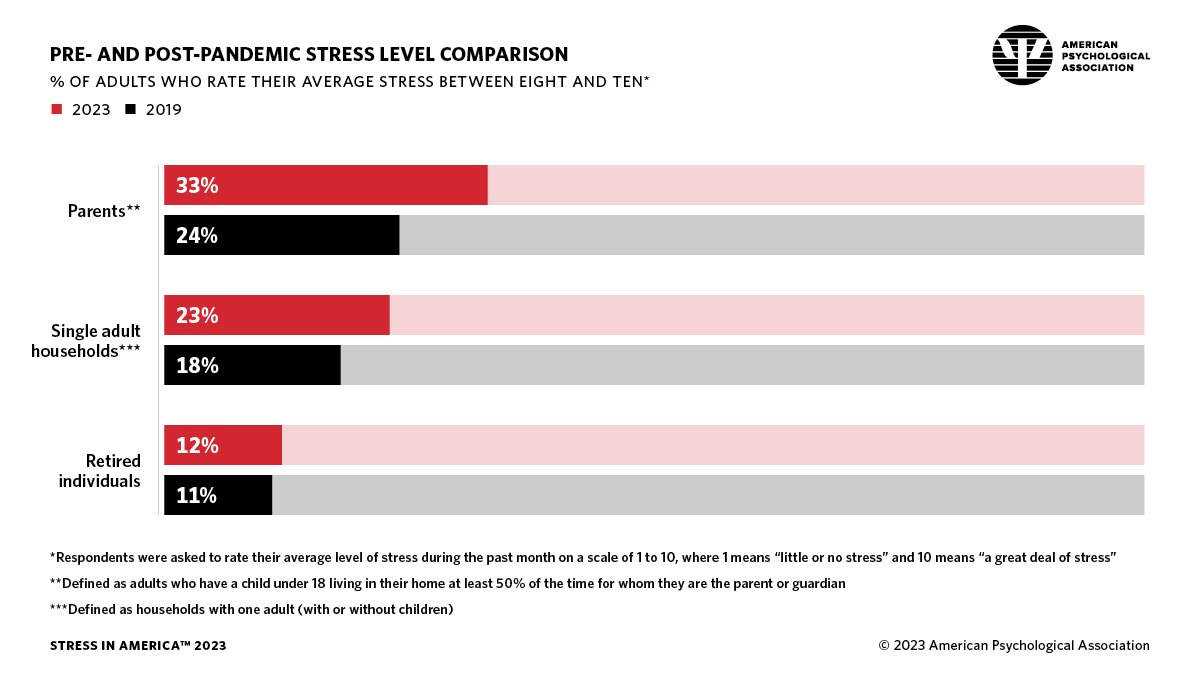
Details of infographic from APA’s October 2023 Stress in America survey
Pre- and post-pandemic stress level comparison by household status
Percentage of adults who rate average stress between eight and ten*
Parents**
- 2023: 33%
- 2019: 24%
Single adult households***
- 2023: 23%
- 2019: 18%
Retired individuals
- 2023: 12%
- 2019: 11%
* Respondents were asked to rate their average level of stress during the past month on a scale of 1 to 10, where 1 means “little or no stress” and 10 means “a great deal of stress”
** Defined as adults who have a child under 18 living in their home at least 50% of the time for whom they are the parent or guardian
*** Defined as households with one adult (with or without children)