Infographic: Ages 65+
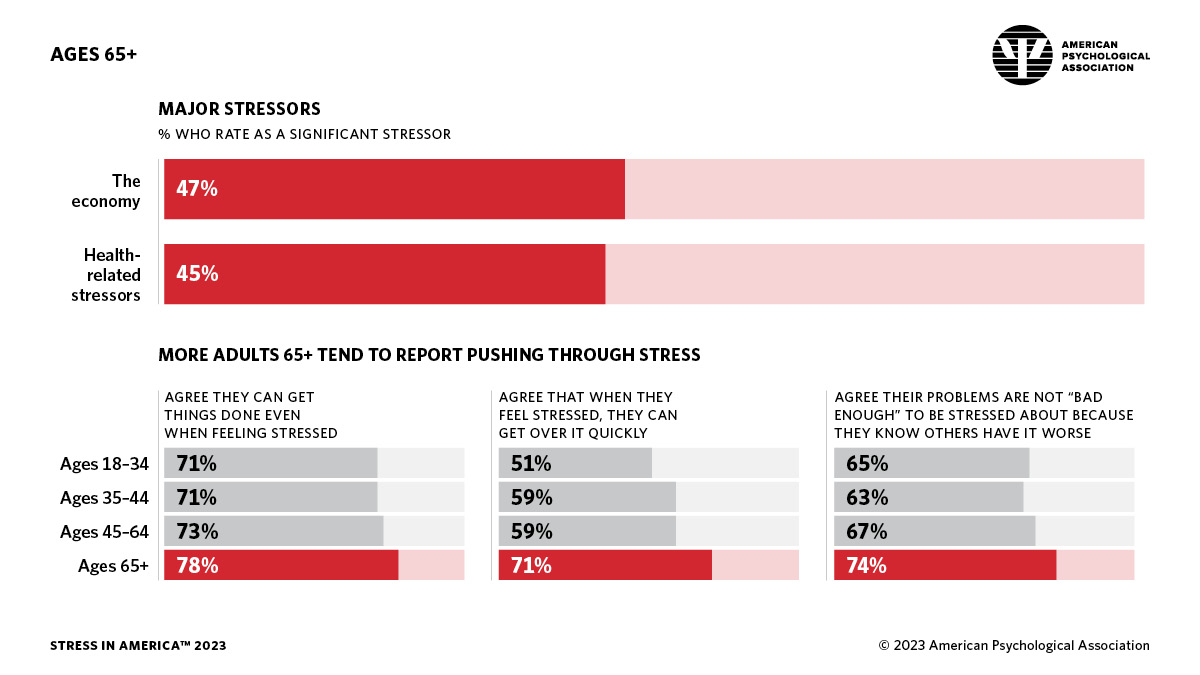
Details of infographic from APA’s October 2023 Stress in America survey
Major stressors
Percentage who rate as a significant stressor
- The economy: 47%
- Health-related stressors: 45%
More adults 65+ tend to report pushing through stress
Agree they can get things done even when feeling stressed
- Ages 18–34: 71%
- Ages 35–44: 71%
- Ages 45–64: 73%
- Ages 65+: 78%
Agree that when they feel stressed, they can get over it quickly
- Ages 18–34: 51%
- Ages 35–44: 59%
- Ages 45–64: 59%
- Ages 65+: 71%
Agree their problems are not “bad enough” to be stressed about because they know others have it worse
- Ages 18–34: 65%
- Ages 35–44: 63%
- Ages 45–64: 67%
- Ages 65+: 74%