Infographic: Reported changes to patient demographics in the last 12 months, 2023
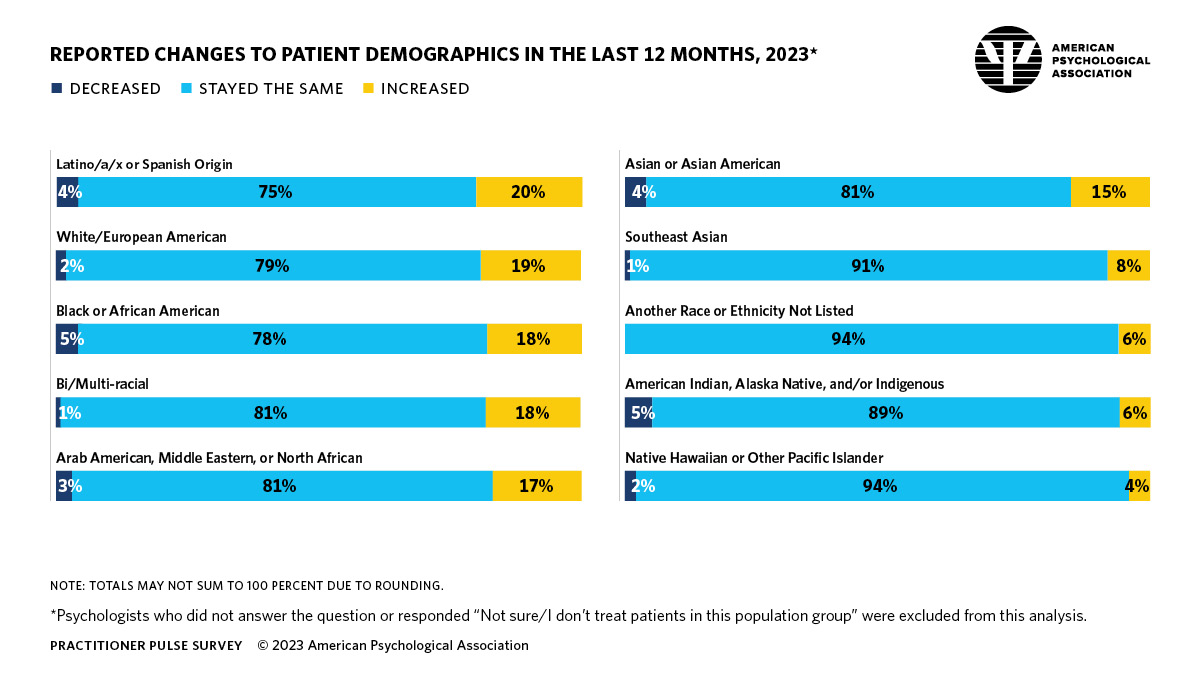
Details of infographic from APA’s 2023 practitioner pulse survey
Percentage of psychologists reporting changes in patients demographics
Note: Psychologists who did not answer the question or responded “Not sure/I don’t treat patients in this population group” were excluded from this analysis. Totals may not sum to 100% due to rounding
Latino/a/x or Spanish origin
- Decreased: 4%
- Stayed the same: 75%
- Increased: 20%
White/European American
- Decreased: 2%
- Stayed the same: 79%
- Increased: 19%
Black or African American
- Decreased: 5%
- Stayed the same: 78%
- Increased: 18%
Bi/multi-racial
- Decreased: 1%
- Stayed the same: 81%
- Increased: 18%
Arab American, Middle Eastern, or North African
- Decreased: 3%
- Stayed the same: 81%
- Increased: 17%
Asian or Asian American
- Decreased: 4%
- Stayed the same: 81%
- Increased: 15%
Southeast Asian
- Decreased: 1%
- Stayed the same: 91%
- Increased: 8%
Another race or ethnicity not listed
- Decreased: 0%
- Stayed the same: 94%
- Increased: 6%
American Indian, Alaska Native, and/or Indigenous
- Decreased: 5%
- Stayed the same: 89%
- Increased: 6%
Native Hawaiian or other Pacific Islander
- Decreased: 2%
- Stayed the same: 94%
- Increased: 4%