Infographic: Reported changes in patient populations being treated in the last 12 months, 2023
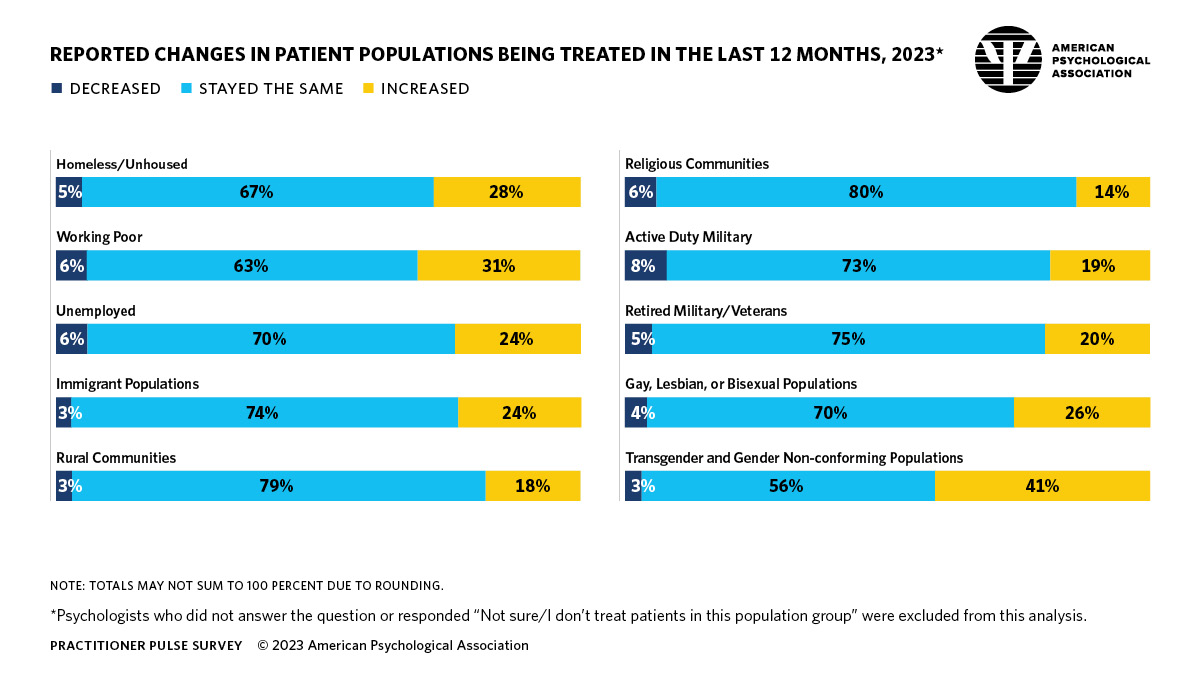
Details of infographic from APA’s 2023 practitioner pulse survey
Percentage of psychologists who reported changes in patient populations receiving treatment
Note: Psychologists who did not answer the question or responded “Not sure/I don’t treat patients in this population group” were excluded from this analysis. Totals may not sum to 100% due to rounding.
Homeless/unhoused
- Decreased: 5%
- Stayed the same: 67%
- Increased: 28%
Working poor
- Decreased: 6%
- Stayed the same: 63%
- Increased: 31%
Unemployed
- Decreased: 6%
- Stayed the same: 70%
- Increased: 24%
Immigrant populations
- Decreased: 3%
- Stayed the same: 74%
- Increased: 24%
Rural communities
- Decreased: 3%
- Stayed the same: 79%
- Increased: 18%
Religious communities
- Decreased: 6%
- Stayed the same: 80%
- Increased: 14%
Active duty military
- Decreased: 8%
- Stayed the same: 73%
- Increased: 19%
Retired military/veterans
- Decreased: 5%
- Stayed the same: 75%
- Increased: 20%
Gay, lesbian, or bisexual populations
- Decreased: 4%
- Stayed the same: 70%
- Increased: 26%
Transgender and gender non-conforming populations
- Decreased: 3%
- Stayed the same: 56%
- Increased: 41%