Infographic: Professionals that psychologists have served with on care teams in the last 12 months, 2023
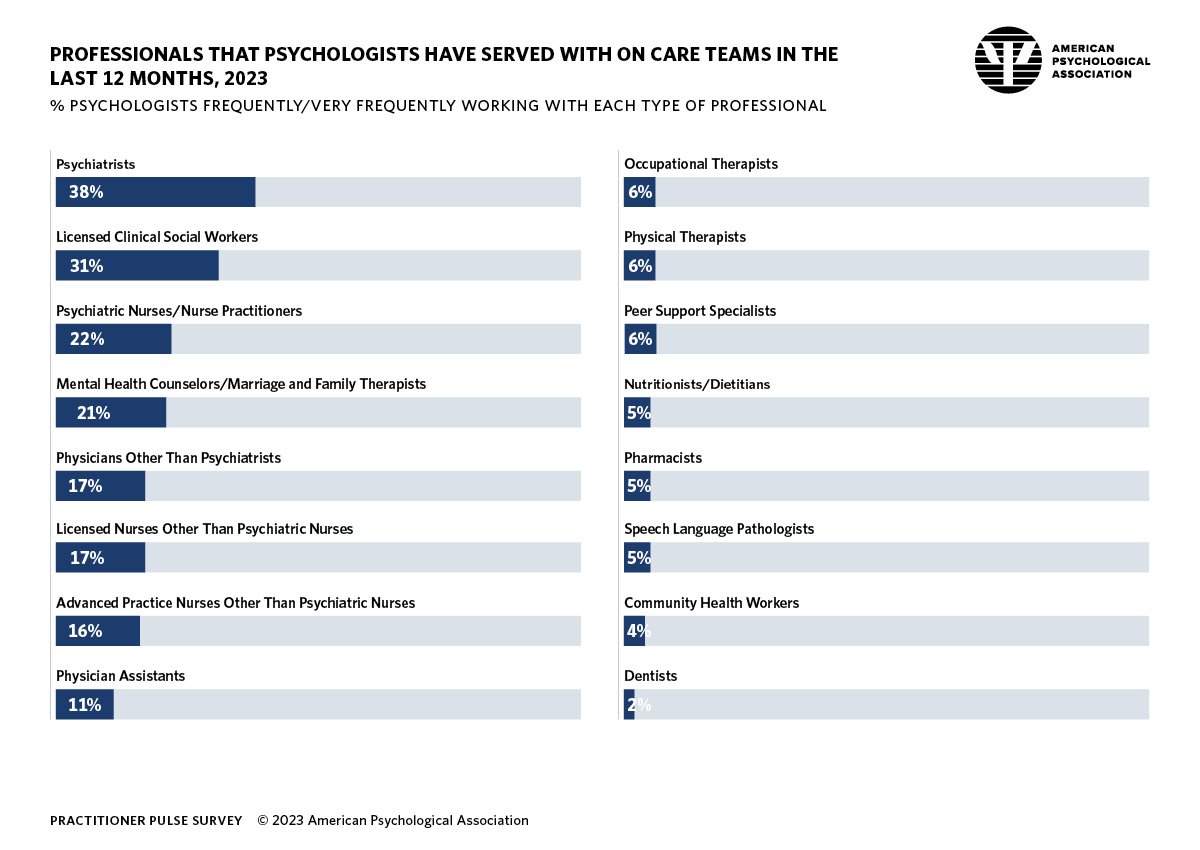
Details of infographic from APA’s 2023 practitioner pulse survey
Percentage of psychologists frequently or very frequently working with each type of professional
- Psychiatrists: 38%
- Licensed clinical social workers: 31%
- Psychiatric nurses/nurse practitioners: 22%
- Mental health counselors/marriage and family therapists: 21%
- Physicians other than psychiatrists: 17%
- Licensed nurses other than psychiatric nurses: 17%
- Advanced practice nurses other than psychiatric nurses: 16%
- Physician assistants: 11%
- Occupational therapists: 6%
- Physical therapists: 6%
- Peer support specialists: 6%
- Nutritionists/dietitians: 5%
- Pharmacists: 5%
- Speech language pathologists: 5%
- Community health workers: 4%
- Dentists: 2%