Infographic: Percentage of psychologists offering remote or in-person treatment, 2020–2023
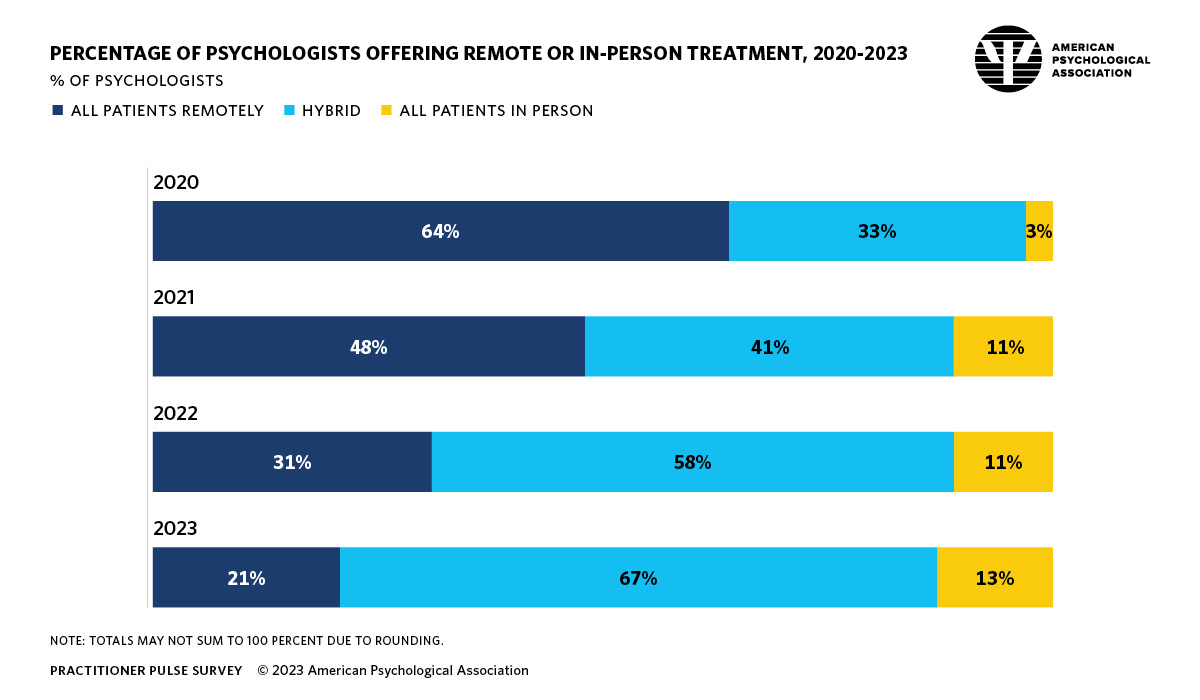
Details of infographic from APA’s 2023 practitioner pulse survey
Percentage of psychologists
Note: Totals may not sum to 100% due to rounding
2020
- All patients remotely: 64%
- Hybrid: 33%
- All patients in-person: 3%
2021
- All patients remotely: 48%
- Hybrid: 41%
- All patients in-person: 11%
2022
- All patients remotely: 31%
- Hybrid: 58%
- All patients in-person: 11%
2023
- All patients remotely: 21%
- Hybrid: 67%
- All patients in-person: 13%