Infographic: Proportion of psychologists seeing changes in their workloads in the last 12 months, 2023
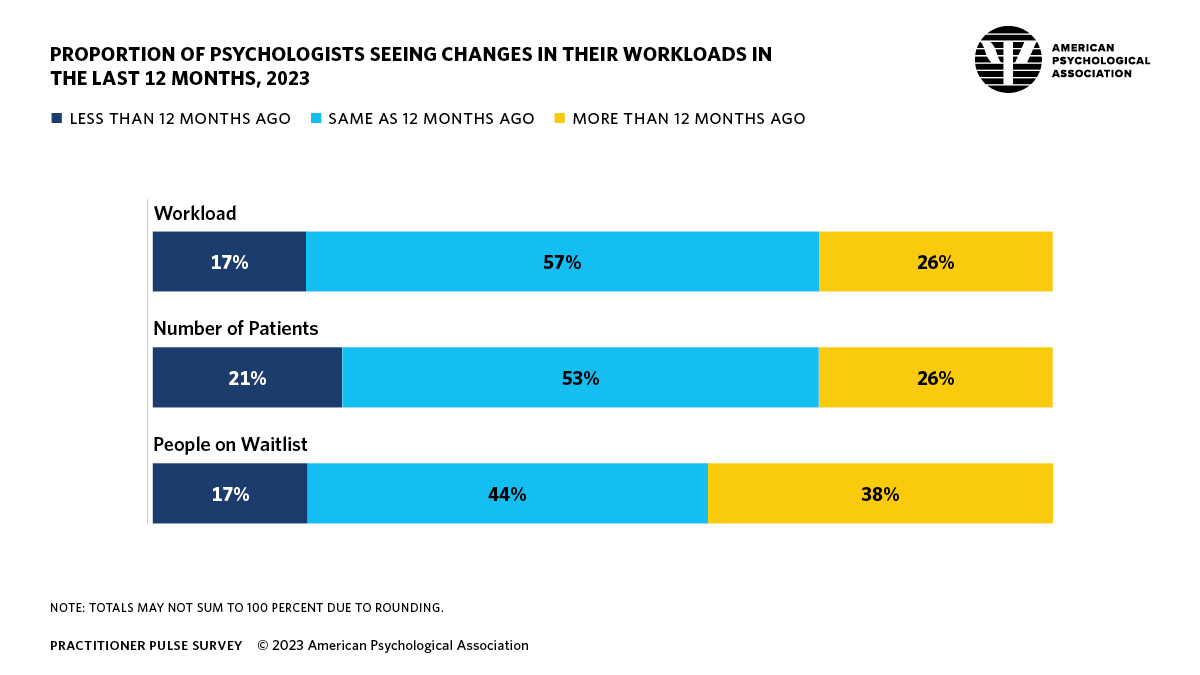
Details of infographic from APA’s 2023 practitioner pulse survey
Percentage of psychologists who reported increases
Note: Totals may not sum to 100% due to rounding
Workload
- Less than 12 months ago: 17%
- Same as 12 months ago: 57%
- More than 12 months ago: 26%
Number of patients
- Less than 12 months ago: 21%
- Same as 12 months ago: 53%
- More than 12 months ago: 26%
People on waitlist
- Less than 12 months ago: 17%
- Same as 12 months ago: 44%
- More than 12 months ago: 38%