Infographic: Changes in workload
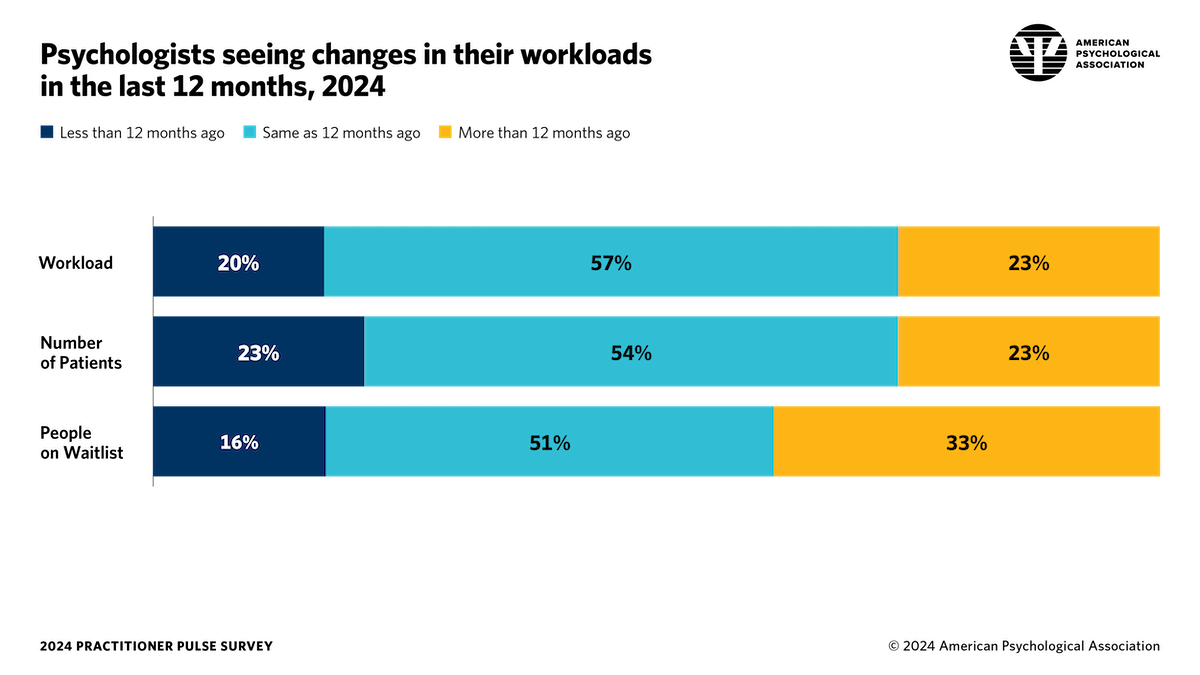
Details of infographic from APA’s 2024 Practitioner Pulse Survey
Psychologists seeing changes in their workloads in the last 12 months, 2024
Workload
- Less than 12 months ago: 20%
- Same as 12 months ago: 57%
- More than 12 months ago: 23%
Number of patients
- Less than 12 months ago: 23%
- Same as 12 months ago: 54%
- More than 12 months ago: 23%
People on waitlist
- Less than 12 months ago: 16%
- Same as 12 months ago: 51%
- More than 12 months ago: 33%