Infographic: Younger adults are more comfortable working with people their own age than others
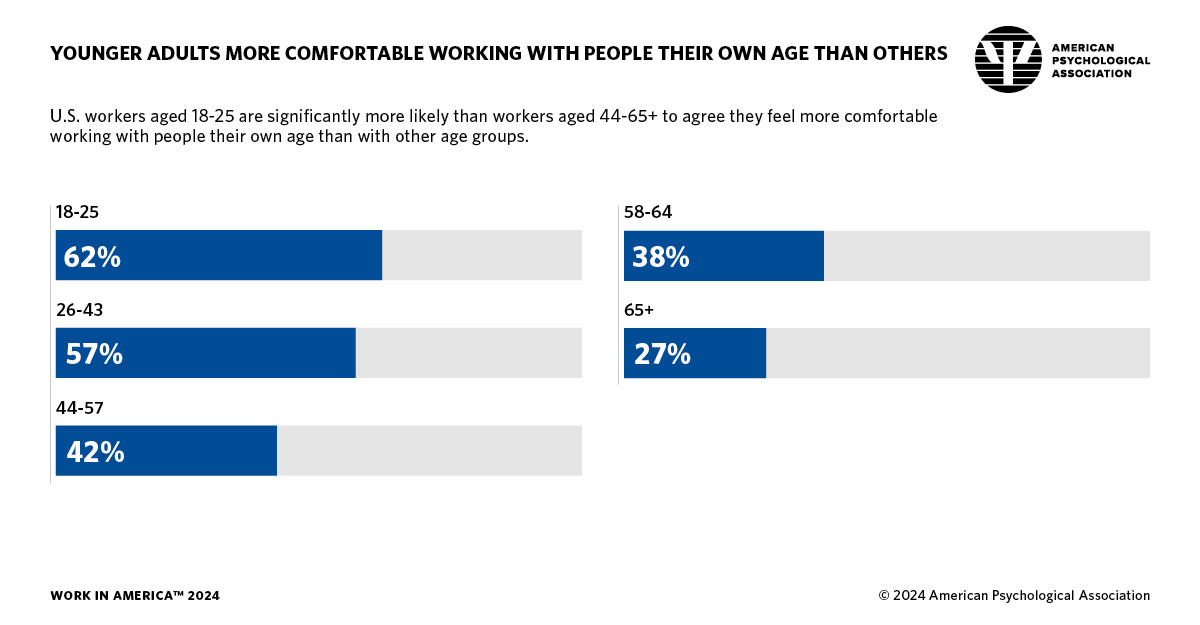
Details of infographic from APA’s 2024 Work in America™ survey
U.S. workers aged 18–25 are significantly more likely than workers aged 44–65+ to agree they feel more comfortable working with people their own age than with other age groups.
- 18–25: 62%
- 26–43: 57%
- 44–57: 42%
- 58–64: 38%
- 65+: 27%