Infographic: Comparisons across roles and time for physical violence
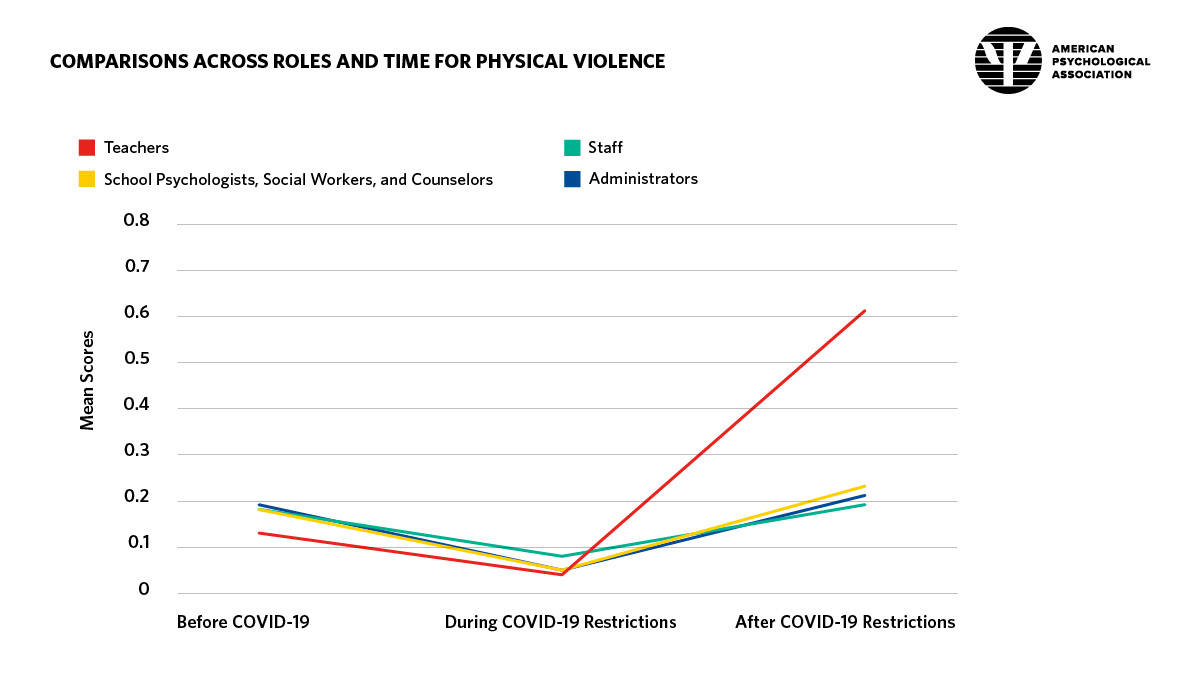
Details of infographic from APA’s 2024 Violence and Aggression Against Educators and School Personnel report
Mean score comparisons across roles and time for physical violence as reported by teachers; staff; school psychologists, social workers, and counselors; and administrators before, during, and after COVID-19 restrictions
Teachers
- Before COVID-19: 0.13
- During COVID-19 restrictions: 0.04
- After COVID-19 restrictions: 0.61
School psychologists, social workers, and counselors
- Before COVID-19: 0.18
- During COVID-19 restrictions: 0.05
- After COVID-19 restrictions: 0.23
Staff
- Before COVID-19: 0.18
- During COVID-19 restrictions: 0.08
- After COVID-19 restrictions: 0.19
Administrators
- Before COVID-19: 0.19
- During COVID-19 restrictions: 0.05
- After COVID-19 restrictions: 0.21