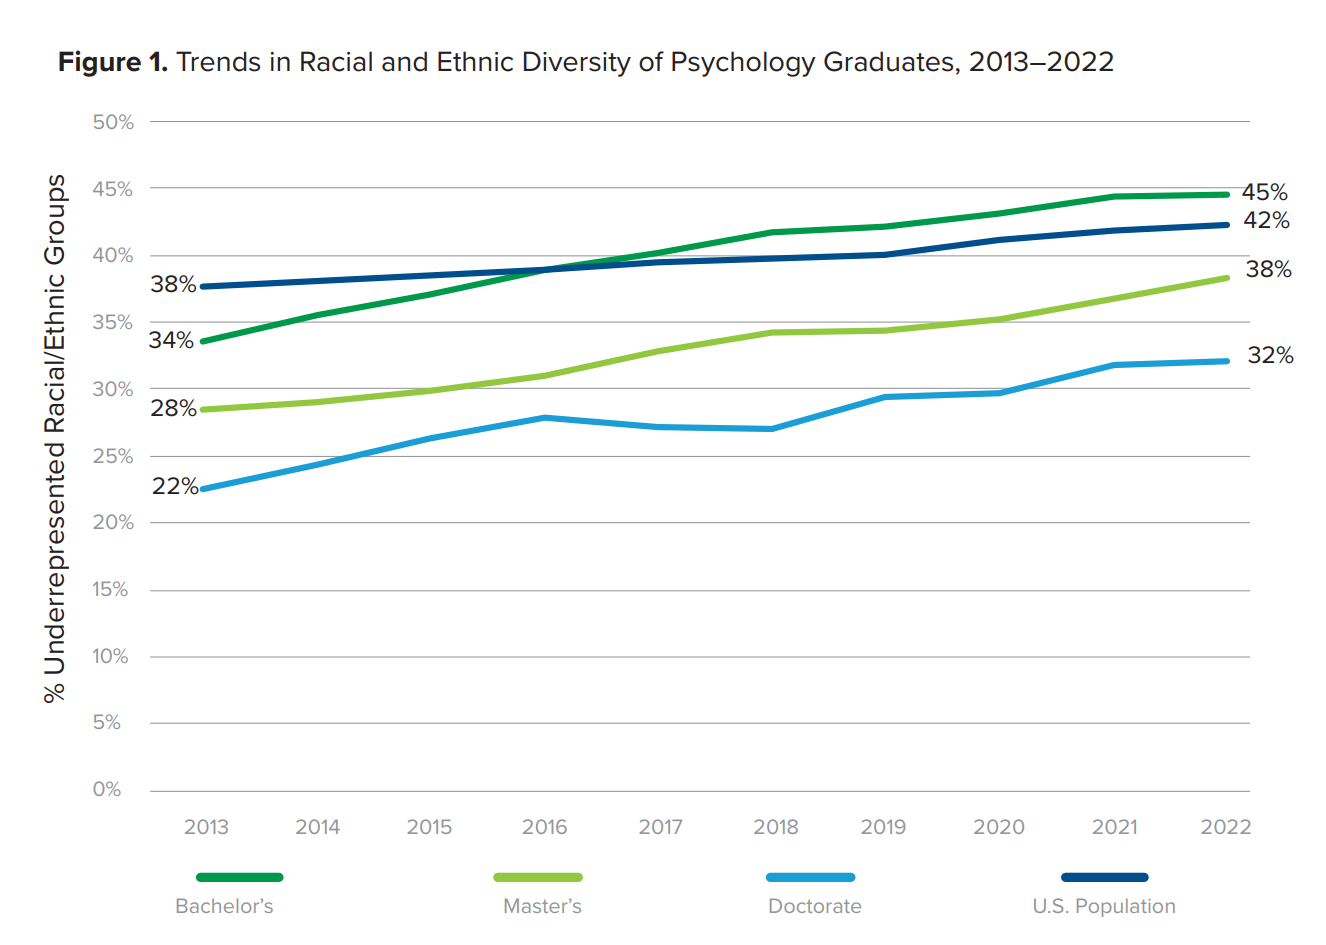
Figure 1. Trends in Racial and Ethnic Diversity of Psychology Graduates, 2013–2022
% Underrepresented Racial/Ethnic Groups
Bachelor’s
- 2013: 34%
- 2022: 45%
Master’s
- 2013: 28%
- 2022: 38%
Doctorate
- 2013: 22%
- 2022: 32%
U.S. Population
- 2013: 38%
- 2022: 42%