Infographic: Changes in patient demographics (age)
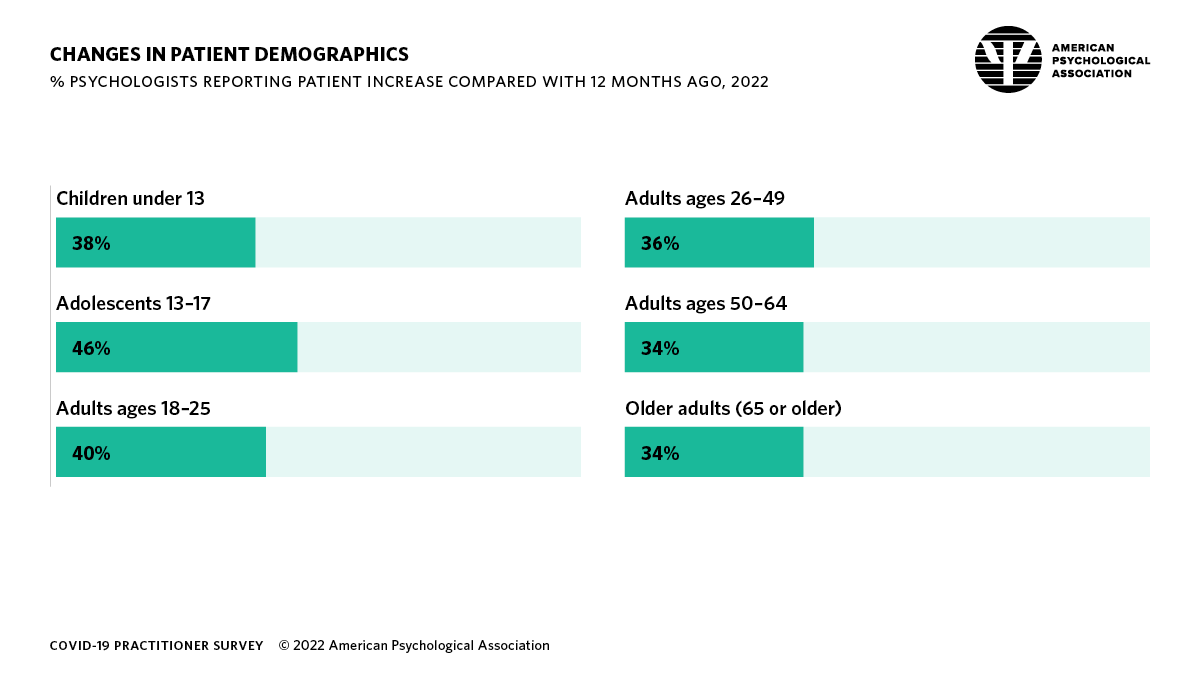
Details of infographic from APA’s 2022 Covid-19 practitioner impact survey
Percentage of psychologists reporting patient increase compared with 12 months ago, 2022
- Children under 13: 38%
- Adolescents 13–17: 46%
- Adults ages 18–25: 40%
- Adults ages 26–49: 36%
- Adults ages 50–64: 34%
- Older adults (65 or older): 34%