Infographic: Changes in patient demographics (population group)
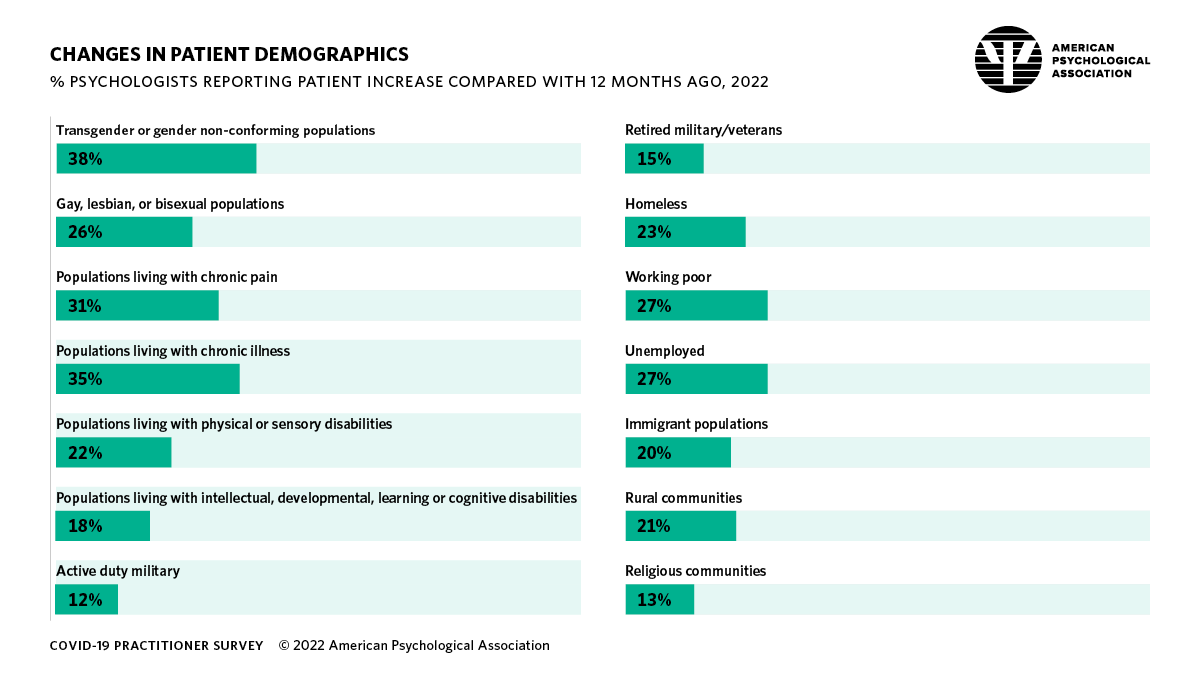
Details of infographic from APA’s 2022 Covid-19 practitioner impact survey
Percentage of psychologists reporting patient increase compared with 12 months ago, 2022
- Transgender or gender nonconforming populations: 38%
- Gay, lesbian, or bisexual populations: 26%
- Populations living with chronic pain: 31%
- Populations living with chronic illness: 35%
- Populations living with physical or sensory disabilities: 22%
- Populations living with intellectual, developmental, learning, or cognitive disabilities: 18%
- Active duty military: 12%
- Retired military/veterans: 15%
- Homeless: 23%
- Working poor: 27%
- Unemployed: 27%
- Immigrant populations: 20%
- Rural communities: 21%
- Religious communities: 13%