Infographic: Changes in patient demographics (racial/ethnic group)
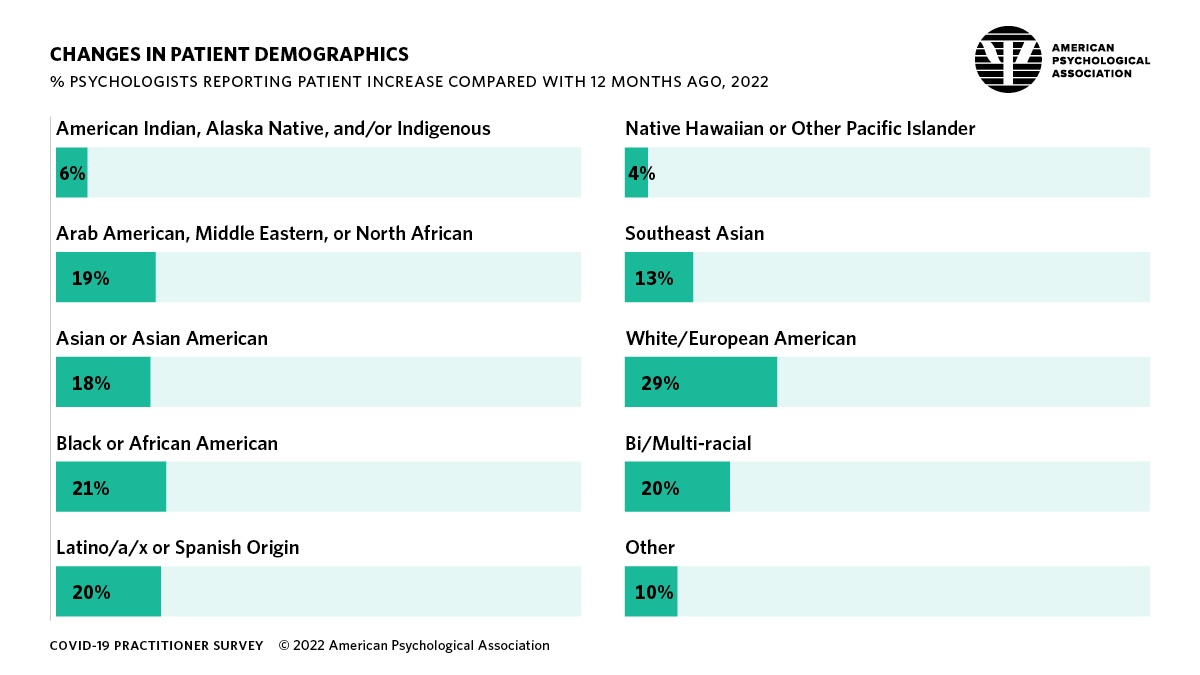
Details of infographic from APA’s 2022 Covid-19 practitioner impact survey
Percentage of psychologists reporting patient increase compared with 12 months ago, 2022
- American Indian, Alaska Native, and/or Indigenous: 6%
- Arab American, Middle Eastern, or North African: 19%
- Asian or Asian American: 18%
- Black or African American: 21%
- Latino/a/x or Spanish origin: 20%
- Native Hawaiian or other Pacific Islander: 4%
- Southeast Asian: 13%
- White/European American: 29%
- Bi/Multiracial: 20%
- Other: 10%