Infographic: Number of people on the waitlist, 2022
Details of infographic from APA’s 2022 Covid-19 practitioner impact survey
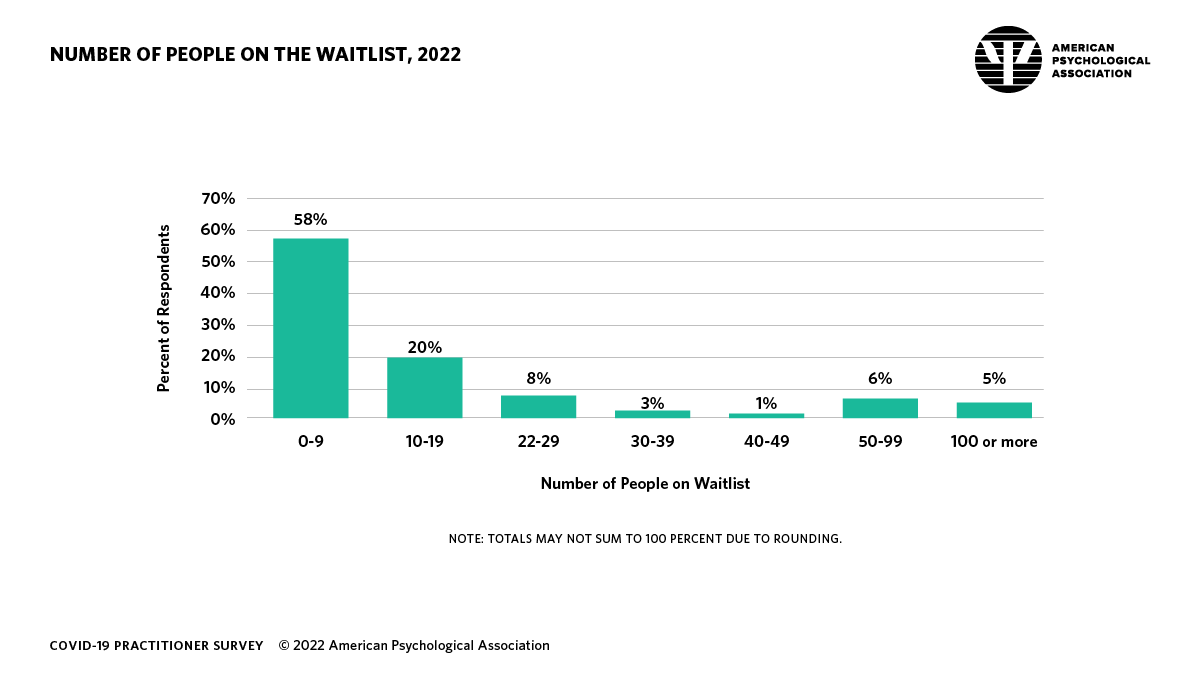
Number of people on the waitlist, 2022
Note: totals may not sum to 100% due to rounding
- 0–9: 58% of respondents
- 10–19: 20% of respondents
- 22–29: 8% of respondents
- 30–39: 3% of respondents
- 40–49: 1% of respondents
- 50–99: 6% of respondents
- 100 or more: 5% of respondents