Infographic: Workload changes, 2020–2022
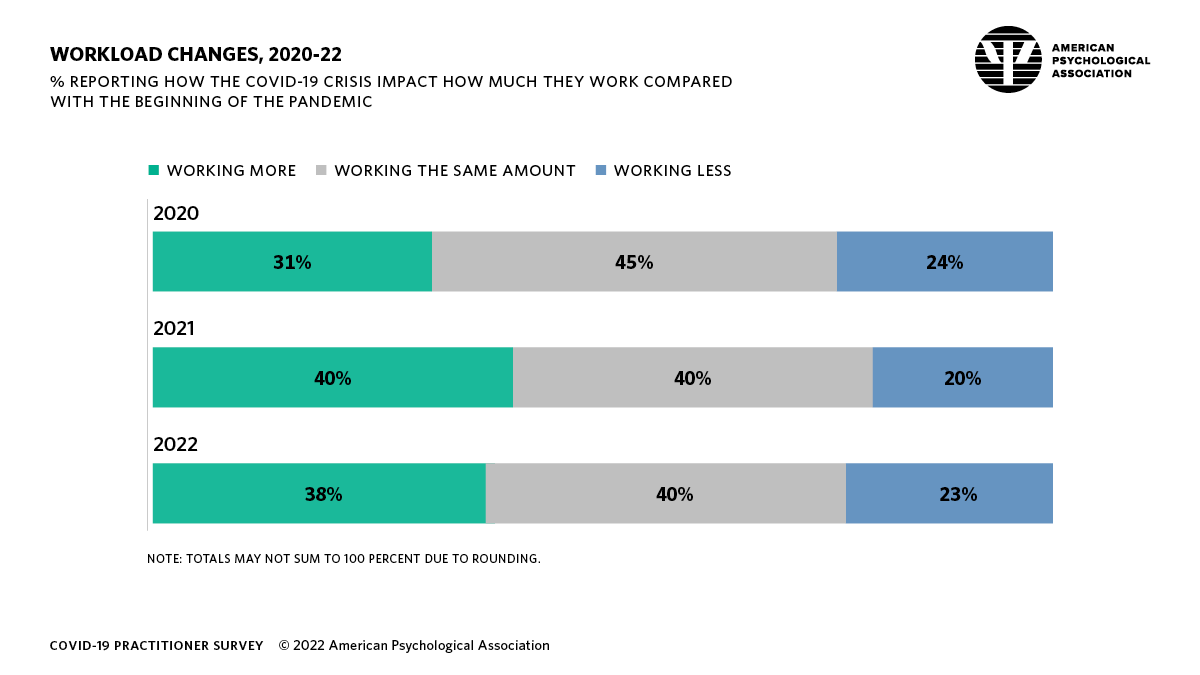
Details of infographic from APA’s 2022 Covid-19 practitioner impact survey
Percentage reporting how the Covid-19 crisis impact how much they work compared with the beginning of the pandemic
Note: totals may not sum to 100% due to rounding
2020
- Working more: 31%
- Working the same amount: 45%
- Working less: 24%
2021
- Working more: 40%
- Working the same amount: 40%
- Working less: 20%
2022
- Working more: 38%
- Working the same amount: 40%
- Working less: 23%