Each January, the APA Education Directorate contacts chairs of graduate psychology departments regarding the upcoming annual Graduate Study in Psychology survey. In February, chairs (or their authorized department contacts) receive a secure URL to access and complete the survey. Up to five reminders are sent to departments until the survey is completed. Departments not updating information for two subsequent years are removed from the database and their information not included in the updated version of the book. Information not updated in a single year is incorporated in that year’s edition, but notated that data are from the prior year in the publication.
For the 2018 survey, 477 departments offering graduate degree programs in psychology or related training (e.g., mental health counseling, marriage and family therapy) provided complete responses to the survey providing data from the 2015-16 academic year. Table 1 breaks out the participation by the self-reported type of college/school/institution in which the department is housed. A substantial majority of departments (62%) were located within a comprehensive university college of arts and sciences followed by those within a university college/schools of education (17 percent). These departments were comprised of 1,438 programs in 2018 as shown in Table 2. Among the 533 departments supplying partial information for the survey, master’s level only training was offered by nearly a quarter (23 percent) of responding departments, 40 percent reported doctoral only offerings and more than one third of departments (37 percent) offering both master’s and doctoral programs.
Table 1. Departmental Participation in 2018 Graduate Study in Psychology Survey by Department Location
|
Type of Department
|
N
|
%
|
|
University College of Arts and Sciences
|
297
|
62.3
|
|
University College/School of Education
|
82
|
17.2
|
|
Free-standing Professional School
|
36
|
7.5
|
|
University-based Professional School
|
25
|
5.2
|
|
Medical School/Health Sciences University
|
8
|
1.7
|
|
Other
|
29
|
6.1
|
|
Total
|
477
|
100.0
|
Notes. N=477. Values may total to greater than 100 percent due to rounding. Departments not identifying an institutional location were excluded from analysis.
Table 2. Program Participation in 2018 Graduate Study in Psychology Survey by Department Location
|
Type of Department
|
N
|
%
|
|
University College of Arts and Sciences
|
987
|
67.2
|
|
University College/School of Education
|
238
|
16.6
|
|
Free-standing Professional School
|
91
|
6.3
|
|
University-based Professional School
|
58
|
4.0
|
|
Medical School/Health Sciences University
|
19
|
1.3
|
|
Other
|
65
|
4.5
|
|
Total
|
1,438
|
100.0
|
Notes. N=1,438. Departments not identifying an institutional location were excluded from analysis.
Departments were asked to rate the importance of 10 criteria in their application review process on a three- point scale (low-medium-high). Figure 1 summarizes the relative importance of each criterion by type of psychology department and across all departments. The filled in area of the icons for each cell increases commensurately with the level of importance; thus, completely filled in circles represent the highest level of importance (e.g., GPA for all departments) while fine-weight circle outlines correspond to the least level of aggregate importance (e.g., OTHER for most departments). Across all departments, Undergraduate GPA (GPA), recommendation letters (LETTERS), and statement of academic/career goals (GOALS) consistently scored as the most important admissions review criteria across all department locations. Anecdotal variance between freestanding professional schools (typically training graduates for professional/applied careers) and other institutions was most prominent with test scores (GRE); with the former department type largely scoring this criterion as low in importance. Although in aggregate, “Other” departments emphasize test scores less compared to other department types, applicants should interpret this cautiously and recognize potential importance differences given department and program goals (e.g., training for applied/professional practice or research/academic careers). Results indicate that in comparison to other departments, preparation in psychology (PSYCPREP) is notably important for those housed within university colleges of arts and sciences and university-based professional schools; perhaps reflecting training offerings within the scope of APA accreditation in which training in discipline-specific knowledge and profession-wide competencies receive greater focus as part of the recently implemented Standards of Accreditationopens in new window (PDF, 1.2MB). Across most department types, work and clinical experience is rated as less important, except at professional schools; both university- based and freestanding professional schools. In addition to GPA, LETTERS and GOALS, university colleges of arts and sciences place high importance on candidates’ research experience as would be expected in departments conferring primarily PhD and MS degrees.

A total of 543 departments provided information about application fees required of prospective students by the institution. These fees ranged in dollars from $0 to $125 per application in 2018, with a mean of $57 (SD=$24.53) and a median of $55 as was also reported in 2017. Ninety-six percent of responding departments required a separate application fee for each program to which a prospective student applied (when permitted), but some allowed applications to multiple programs within a department or school on a single fee. Figure 2 presents the interquartile ranges for application fees across all participating departments and split by public versus private and not-for-profit institutions where permissible.

Figure 3 presents the interquartile ranges of applications by broad psychology subfields; descriptions of these subfields are provided in the appendix. The majority of departments offering terminal master’s degrees in these subfields received median number of applications between 20 and 40 for the most recent application cycle, except clinical counseling and I/O psychology reporting median applications near 50. Interquartile ranges varied, with the greatest amount found in clinical psychology, counseling psychology, industrial/organizational psychology, other applied psychology and other psychology. Acceptances are shown in Figure 4 and featured similar ranges, but with median acceptances falling between 5 and 20, except in counseling and other psychology. Figure 5 plots the interquartile master’s-level acceptance rates; defined as the ratio of acceptances to applications. Median acceptance rates for most subfields at the master’s level hovered between 35 percent and 65 percent, but the median social psychology acceptance rates was at 29 percent. The median acceptance rate for the other psychology subfields (69 percent) was highest in comparison, but encompassed one of the widest interquartile ranges extending from 49 percent to 80 percent.


Applications for doctoral programs are presented in Figure 6 by subfield. The largest number of applications across the greatest interquartile range, were found in clinical psychology with a median of 149 applications. Counseling psychology, industrial/organizational psychology, and social psychology represented the next largest numbers of applications. Figure 7 shows the ranges of acceptances by subfield. As was also found in 2017, 2018 median acceptances for clinical psychology were 11 and median acceptances for all other subfields were below 10. Acceptance rates for doctoral programs, as shown in Figure 8, were noticeably lower in comparison to master’s programs, with the median rates for doctoral clinical psychology and social psychology at 8 percent for both. The highest median acceptance rates for doctoral programs were found in school psychology and other applied psychology at 32 percent and 25 percent, respectively.
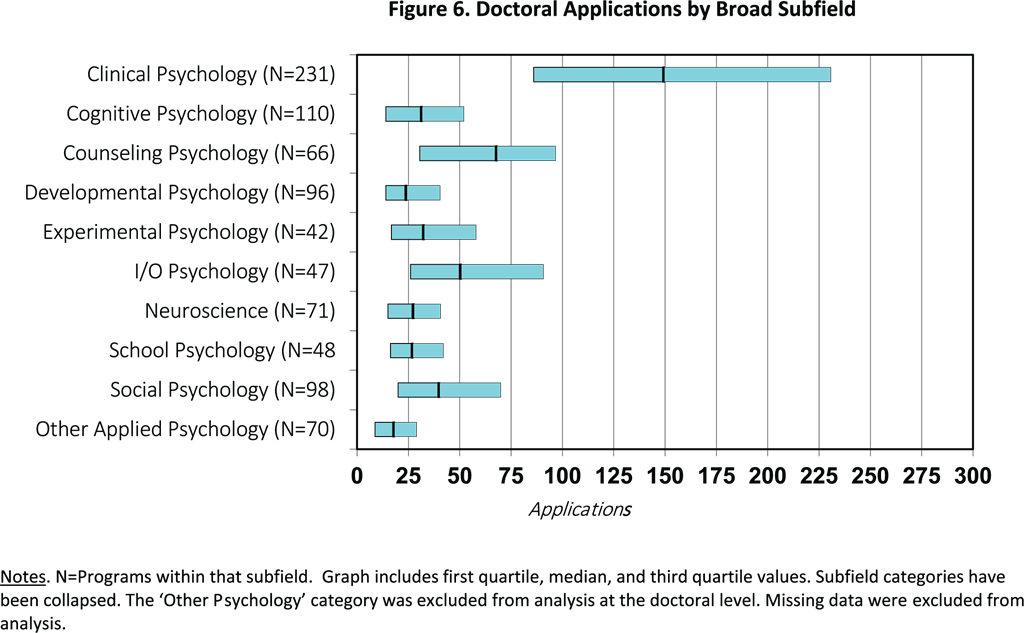

Table 3 summarizes total applications, acceptances and acceptance rates by broad subfield for both master’s- and doctoral-level programs participating in the survey.
Compared to doctoral programs, acceptance rates for master’s programs were substantially higher for all subfields, yet the numbers of applications were less than half of the application numbers for doctoral programs; approximately 24,000 to 69,000, respectively. Counseling psychology programs received the highest number of both applications and acceptances at the master’s level with an acceptance rate of 57 percent. However, it is important to note that many of the participating programs in this category identify as ‘Counseling’ programs that grant degrees designed to train graduates for careers as licensed professional counselors in psychology-related health services. Acceptance rates were lowest for social psychology and clinical psychology at 27 percent and 31 percent, respectively.
At the doctoral level, the highest number of programs, applications, and acceptances were found in clinical psychology, but with an overall acceptance rate of 12 percent. Acceptance rates for doctoral programs ranged between 8 percent and 15 percent across most subfields, but were noticeably higher for school psychology (31 percent) and other applied psychology (21 percent) Although nearly than 4 out of 5 (78 percent) of applications to other psychology subfield programs were accepted, the low number of programs (6) limits meaningful interpretation.
Table 3. Sum of Applications, Acceptances, and Overall Acceptance Rates by Degree Level & Broad Subfield
|
Subfield
|
Master’s
|
Doctoral
|
|
|
|
Applied
|
Accepted
|
Acceptance Rate
|
Applied
|
Accepted
|
Acceptance Rate
|
|
Clinical
Psychology
|
N
|
58
|
57
|
31.4%
|
231
|
231
|
12.1%
|
|
Sum
|
3,085
|
970
|
39,781
|
4,806
|
|
Cognitive
Psychology
|
N
|
10
|
10
|
37.4%
|
110
|
110
|
11.9%
|
|
Sum
|
281
|
105
|
4,518
|
539
|
|
Counseling
Psychology
|
N
|
92
|
92
|
56.8%
|
66
|
66
|
11.4%
|
|
Sum
|
6,874
|
3,902
|
5,191
|
592
|
|
Developmental
Psychology
|
N
|
19
|
19
|
51.5%
|
96
|
96
|
14.9%
|
|
Sum
|
452
|
233
|
2,919
|
434
|
|
Experimental
Psychology
|
N
|
81
|
81
|
44.1%
|
42
|
42
|
12.1%
|
|
Sum
|
3,668
|
1,619
|
2,388
|
288
|
|
Industrial/Org. Psychology
|
N
|
61
|
61
|
38.2%
|
47
|
47
|
12.8%
|
|
Sum
|
3,237
|
1,238
|
2,826
|
362
|
|
Neuroscience
|
N
|
6
|
6
|
65.4%
|
71
|
71
|
10.3%
|
|
Sum
|
188
|
123
|
2,570
|
265
|
|
School
Psychology
|
N
|
57
|
57
|
55.4%
|
48
|
48
|
31.3%
|
|
Sum
|
2,106
|
1,166
|
1,768
|
553
|
|
Social
Psychology
|
N
|
14
|
14
|
27.2%
|
98
|
98
|
7.9%
|
|
Sum
|
375
|
102
|
5,156
|
409
|
|
Other Applied
Psychology
|
N
|
57
|
57
|
51.8%
|
70
|
70
|
21.4%
|
|
Sum
|
2,842
|
1,473
|
1,482
|
317
|
|
Other
Psychology
|
N
|
16
|
16
|
65.9%
|
6
|
6
|
77.6%
|
|
Sum
|
1,249
|
823
|
634
|
492
|
|
Total
|
N
|
471
|
470
|
48.3%
|
885
|
885
|
13.1%
|
|
Sum
|
24,357
|
11,754
|
69,233
|
9,057
|
Notes. N=Aggregate programs in subfield. Sum=Total number of applications and acceptances by subfield. Acceptance rate is calculated as the ratio of acceptances to applications within that category. Subfield categories have been collapsed (see Appendix 2, Table II for categories).
I. Application Review Criteria
Figure 1 of the report presents ten criteria used by departments for application reviews and plots those by level of importance by institutional location of the department. The table below defines each of the criterion.
|
Review Criteria
|
Description
|
|
GRE
|
Scores from the GRE general and/or subject tests
|
|
Research
|
Prior research experience
|
|
Work
|
Employment/volunteer history and experience
|
|
Clinic
|
Prior clinical experience
|
|
GPA
|
Undergraduate GPA
|
|
Letters
|
Recommendation letters from faculty/supervisors
|
|
Interview
|
Candidate interview
|
|
Goals
|
Statement of students’ academic and career goals
|
|
Psycprep
|
Academic history in psychology and coursework
|
|
Other
|
Other criteria unique to department’s review
|
II. Subfields
Survey respondents were provided a complete list of subfields as shown in the left column of the table below. These categories were then collapsed into broader subfields as shown on the right for reporting purposes.
|
Subfield Response Options
|
Collapsed Subfield
|
|
Experimental Psychology (Applied)
|
Experimental Psychology
|
|
Experimental Psychology (General)
|
|
Biological
|
Neuroscience
|
|
Comparative Psychology
|
|
Neuropsychology
|
|
Neuroscience
|
|
Physiological
|
|
Psychopharmacology
|
|
Health*
|
Social Psychology
|
|
Personality
|
|
Social
|
|
Child and Adolescent
|
Developmental Psychology
|
|
Developmental
|
|
Human Development and Family Studies
|
|
Geropsychology
|
|
Clinical
|
Clinical Psychology
|
|
Health*
|
|
Primary Care
|
|
Psychoanalytic
|
|
Consulting
|
I/O Psychology
|
|
Industrial/Organizational
|
|
Counseling Psychology
|
Counseling Psychology
|
|
Community Counseling
|
|
Family Psychology
|
|
Marriage and Family Therapy
|
|
Mental Health Counseling
|
|
Rehabilitation
|
|
Cognitive Psychology
|
Cognitive Psychology
|
|
Human Factors
|
|
Psycholinguistics
|
|
School Psychology
|
School Psychology
|
|
School Counseling
|
|
Applied Behavior Analysis
|
Other Applied Psychology
|
|
Community Psychology
|
|
Educational Psychology
|
|
Forensic Psychology
|
|
Sport Psychology
|
|
Quantitative Psychology
|
|
Behavioral
|
|
Environmental
|
Other Psychology
|
|
General Psychology
|
|
Humanistic
|
|
Multicultural
|
*Depending on the nature of training, clinically-oriented Health programs are included in the collapsed Clinical subfield. Other Health programs are included in Social/Personality category.