


While the number of female doctorate recipients in psychology continues to rise, the number of men receiving psychology doctorates has remained stable over the last 10 years.1,2
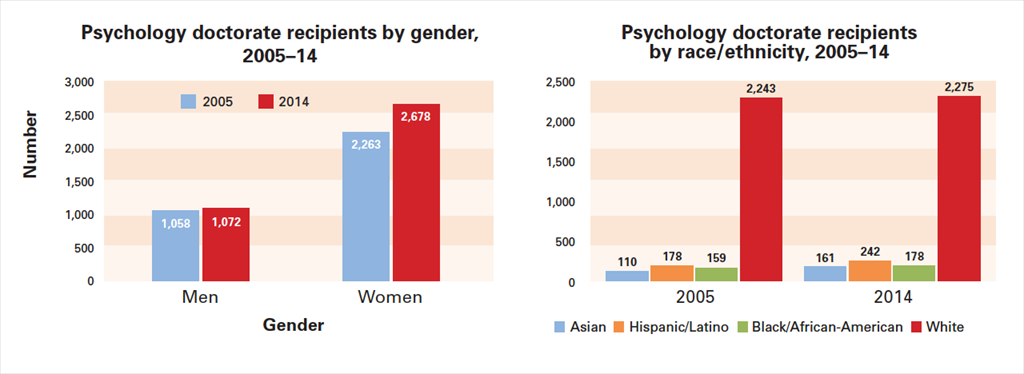
Between 2005 and 2014, the number of psychology doctorate recipients increased by 18 percent for women and only 1 percent for men. In 2005, twice as many women as men received psychology doctorates. By 2014, the ratio of women to men who received psychology doctorates had risen to 2.5 to 1.
The racial/ethnic composition of psychology doctorate recipients has become slightly more diverse over the past decade.3,4 Since 2005, the number of doctorate recipients has grown by 12 percent among Black/African Americans, 36 percent among Hispanic/Latinos and 46 percent among Asians. Despite this growth, in 2014, 75 percent of all psychology doctorate recipients were white.
— Peggy Christidis, PhD, Karen Stamm, PhD, and Luona Lin, MPP
For more information, contact APA's Center for Workforce Studies.
1 National Science Foundation, National Center for Science and Engineering Statistics. (2015). Doctorate recipients from U.S. universities: 2014 (Special Report NSF 16-300). Arlington, VA. Survey of Earned Doctorates. Retrieved from www.nsf.gov/statistics/2016/nsf16300/data-tables.cfmopens in new window.
2 A research doctorate requires the completion of a dissertation or equivalent project and is not primarily intended for the practice of a profession.
3 National Science Foundation, National Center for Science and Engineering Statistics. Doctorate recipients from U.S. universities (Summary Reports from 2005 to 2014).
4 Not all doctorate recipients provided their race/ethnicity. Due to small sample size or missing data, the following race/ethnicity categories were not included in the figure: American Indian or Native Alaskan, more than one race/ethnicity, and other race/ethnicity.