


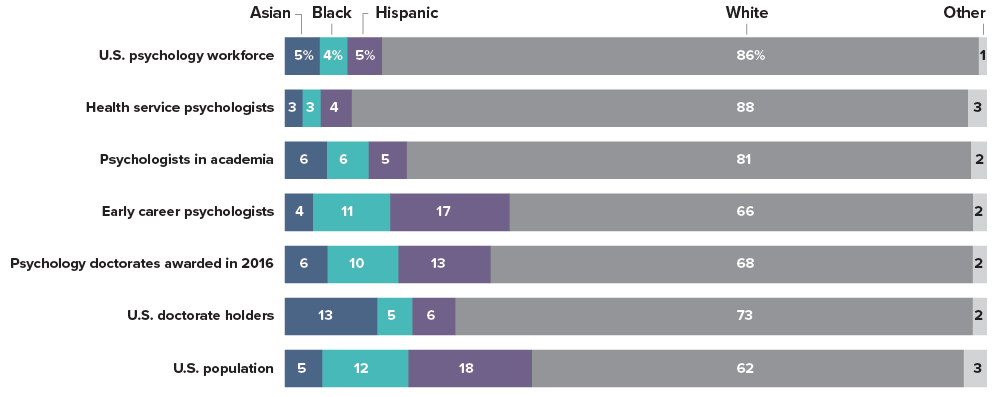
- In 2015, 86 percent of psychologists in the U.S. workforce were white, 5 percent were Asian, 5 percent were Hispanic, 4 percent were black/African-American and 1 percent were multiracial or from other racial/ethnic groups.1 This is less diverse than the U.S. population as a whole, which is 62 percent white and 38 percent racial/ethnic minority.1
- The health service psychology workforce2 was 88 percent white and 12 percent racial/ethnic minorities, and the academic workforce3 was 81 percent white and 19 percent racial/ethnic minorities.
- The psychology workforce is becoming more diverse as more racial/ethnic minorities enter the workforce. In 2015, 66 percent of early career psychologists were white and 34 percent were racial/ethnic minorities.4
- A third (32 percent) of psychology doctorates earned in 2016 were awarded to racial/ethnic minorities, and 68 percent were awarded to whites.5
Diversity of the Psychology Workforce
For more information, contact APA's Center for Workforce Studies at cws@apa.org. To learn more about the demographics of the U.S. psychology workforce, visit the Center for Workforce Studies' new data tools page at www.apa.org/workforce/data-tools.
1 U.S. Census Bureau. (2015). American Community Survey 1-Year PUMS file. Retrieved from www.census.gov/programs-surveys/acs/data/pums.html . "Other" racial/ethnic groups included American Indian/Alaska Native, Native Hawaiian/Pacific Islander, and people of two or more races. U.S. doctorate holders included individuals in the workforce with a doctoral/professional degree in any field. Total may not sum to 100 percent due to rounding.
2 APA. (2016). 2015 Survey of Psychology Health Service Providers. Retrieved from https://www.apa.org/workforce/publications/15-health-service-providers . Health service psychologists included doctoral-level licensed psychologists. (Use caution when comparing racial/ethnic composition across occupation groups and career stages in this report as data are from different sources that used different methods.)
3 National Science Foundation (NSF), National Center for Science and Engineering Statistics. (2013). Survey of Doctorate Recipients. Retrieved from https://ncsesdata.nsf.gov/doctoratework/2013. Psychologists in academia included psychology research doctorate holders employed at four-year colleges or universities, medical schools and university-affiliated research institutes. A research doctorate requires the completion of a dissertation or equivalent project and is not primarily intended for the practice of a profession. The use of data from the NSF does not imply its endorsement of the research, research methods or conclusions contained in this report.
4 NSF, National Center for Science and Engineering Statistics. (2015). National Survey of College Graduates Public Use Microdata File and Codebook. Retrieved from https://ncses.nsf.gov/822/assets/0/files/college_grads_2015.zip. Early career psychologists included employed individuals who have received a doctorate or professional degree in psychology within the last 10 years.
5 U.S. Department of Education, National Center for Education Statistics, Integrated Postsecondary Education Data System. (2015). Completions Surveys. [Data files and dictionaries]. Retrieved from https://nces.ed.gov/ipeds/.