

The U.S. psychology workforce is getting younger
- The age distribution of the psychology workforce changed considerably between 2006 and 2016, as an older generation of psychologists retired and younger psychologists entered the workforce.1
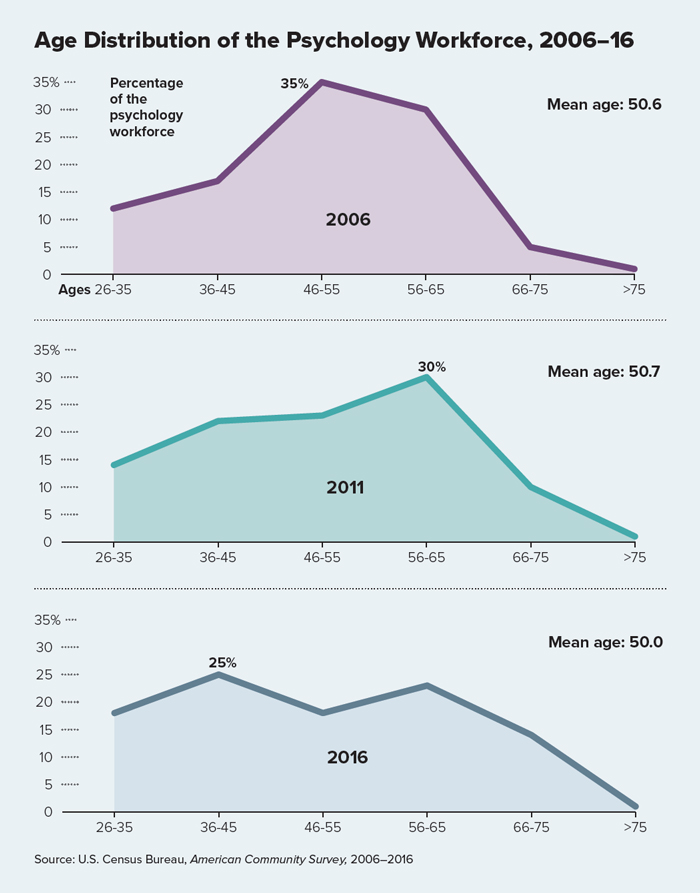
- In 2006, the majority (65 percent) of psychologists were ages 46 to 65. The age distribution peaked at ages 46 to 55 (35 percent). The mean age of the psychology workforce was 50.6 years.
- By 2011, the age distribution peaked at ages 56 to 65 (30 percent). The percentage of psychologists within younger age ranges (26 to 45 years) increased. The mean age of the psychology workforce was 50.7 years.
- By 2016, the percentage at ages 56 to 65 decreased and was surpassed by a new peak of younger psychologists ages 36 to 45 (25 percent). This influx of younger psychologists and the retirement of older psychologists lowered the mean age of the psychology workforce to 50 years.
For an interactive version of this Datapoint, visit the CWS Data Tool at www.apa.org/workforce/data-tools/demographics.
For more information , contact APA's Center for Workforce Studies at cws@apa.org .