
10%
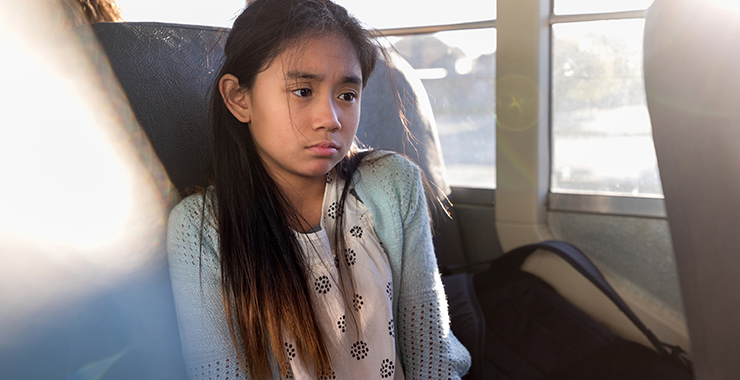
Percentage of Black children ages 10 and 11 who reported being discriminated against because of race, ethnicity, or color. That compares with 6.5% of Native American children of the same ages, 6.2% of Asian/Pacific Islander children, 5.4% of Latino/Hispanic children, and 2.8% of White children.
20.5%
Percentage of Native American children who said their peers treated them unfairly or negatively because of their ethnic background, compared with 20.1% of Black children, 10.9% of Asian/Pacific Islander children, 13% of Latino/Hispanic children, and 8.9% of White children.
8.4%
Percentage of Black children who reported unfair or negative treatment from teachers because of their ethnic background, compared with 7.6% of Native American children, 5.2% of Latino/Hispanic children, 2.2% of Asian/Pacific Islander children, and 1.8% of White children.
6.4%
Percentage of Black children who said they didn’t feel accepted in American society, compared with 3.6% of Latino/Hispanic children, 3.1% of Native American children, 2% of Asian/Pacific Islander children, and 1.5% of White children.