

skip to main content


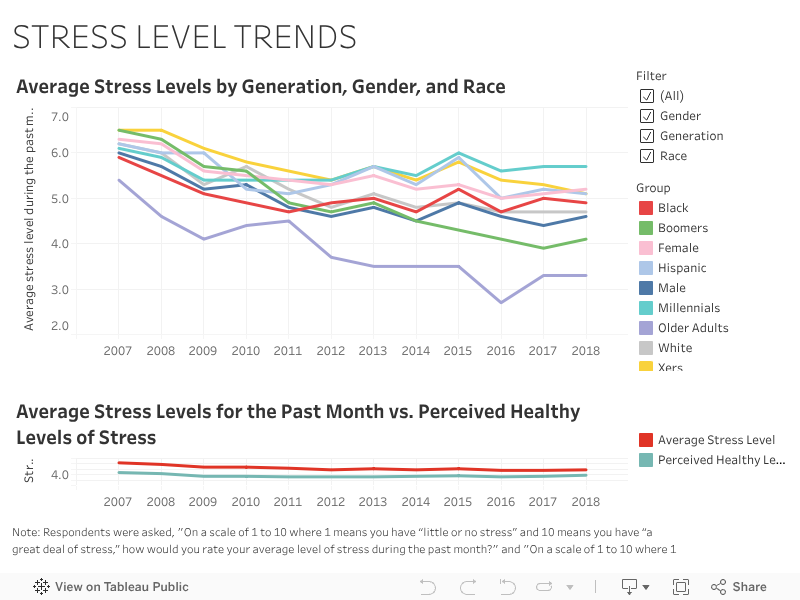
Use the “Filter” tool to narrow data by Gender, Generation, or Race, or click a category under the “Group” legend to highlight the data for that group. Hover over any point to view data. To see a larger version of the graphic, click on the "Enlarge" icon on the right, below the graphic.
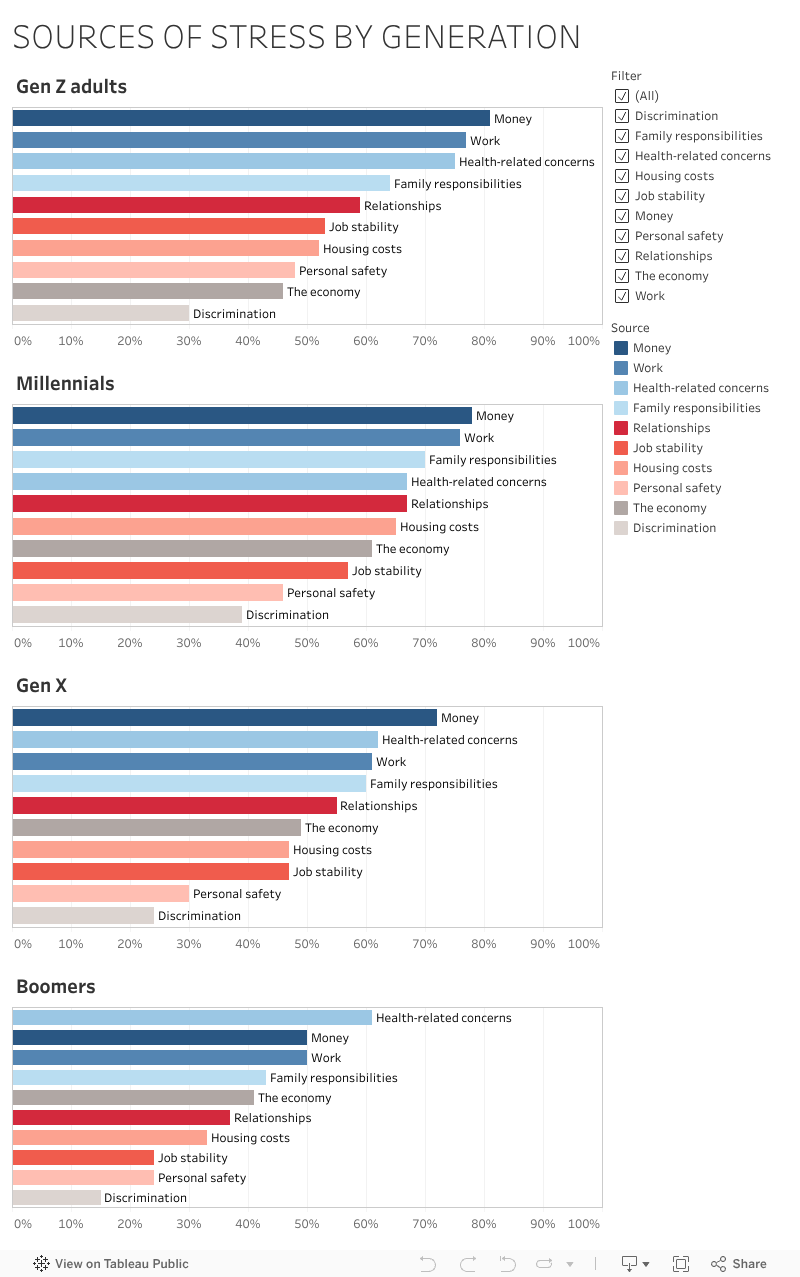

Use the “Filter” tool to compare multiple sources or click a category under the “Source” legend to highlight individual sources for each generation. Hover over any bar to view data.


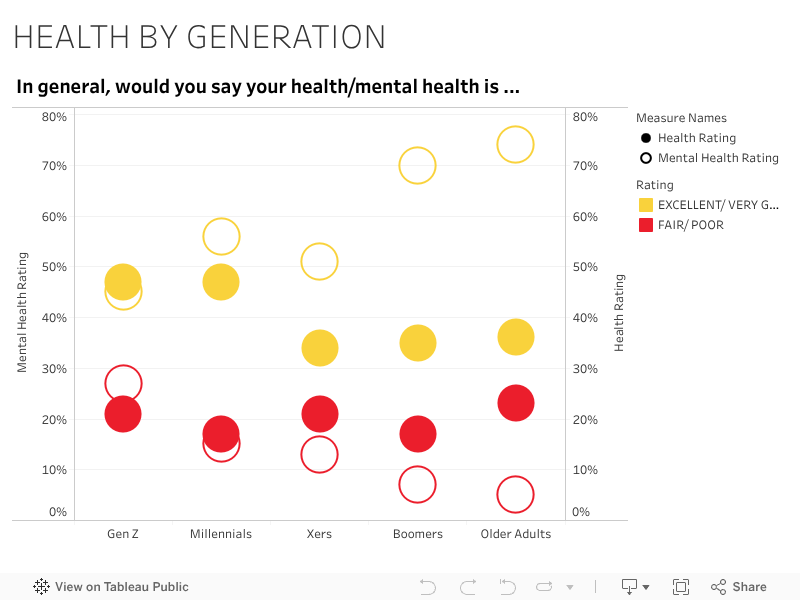
Click under “Measure Names” to highlight data for Health Rating or Mental Health Rating. Use the “Rating” legend to view only Excellent/Very Good or Fair/Poor responses respectively. Hover over any point to view data. To see a larger version of the graphic, click on the "Enlarge" icon to the right, below the graphic.

Date created: 2018