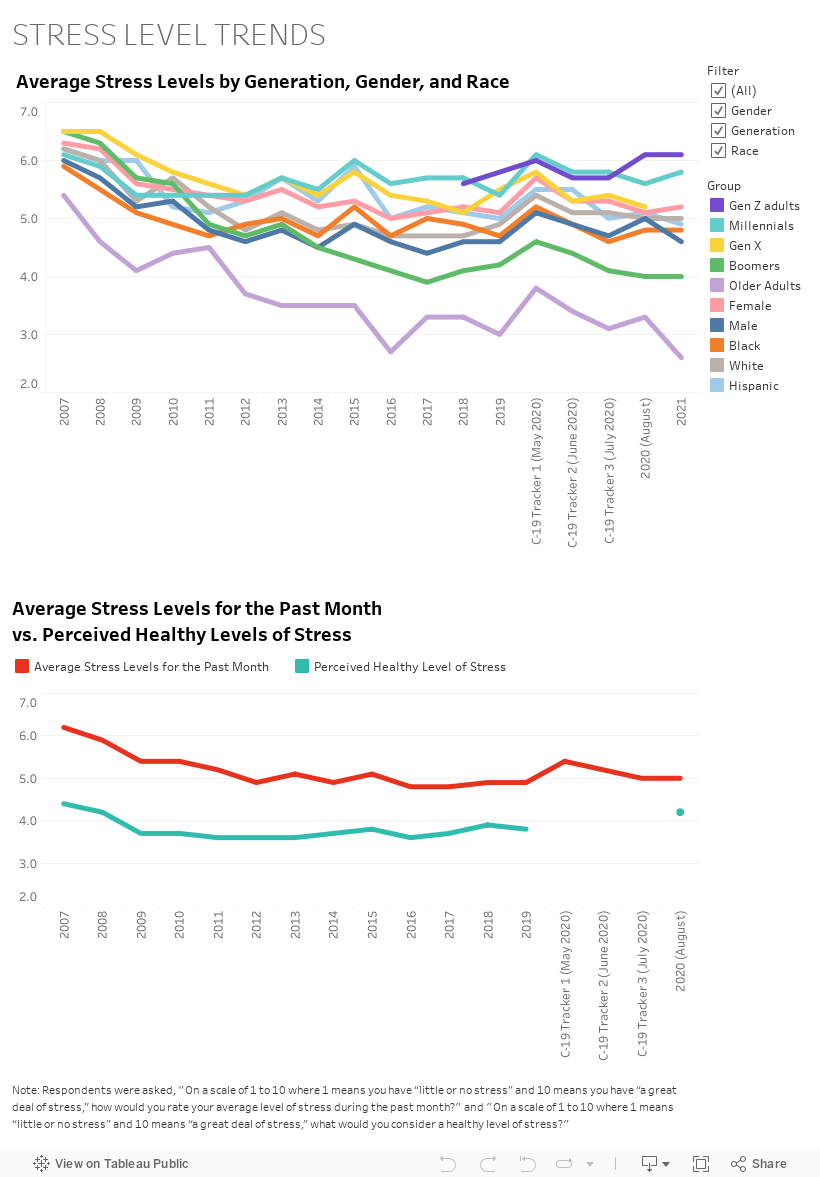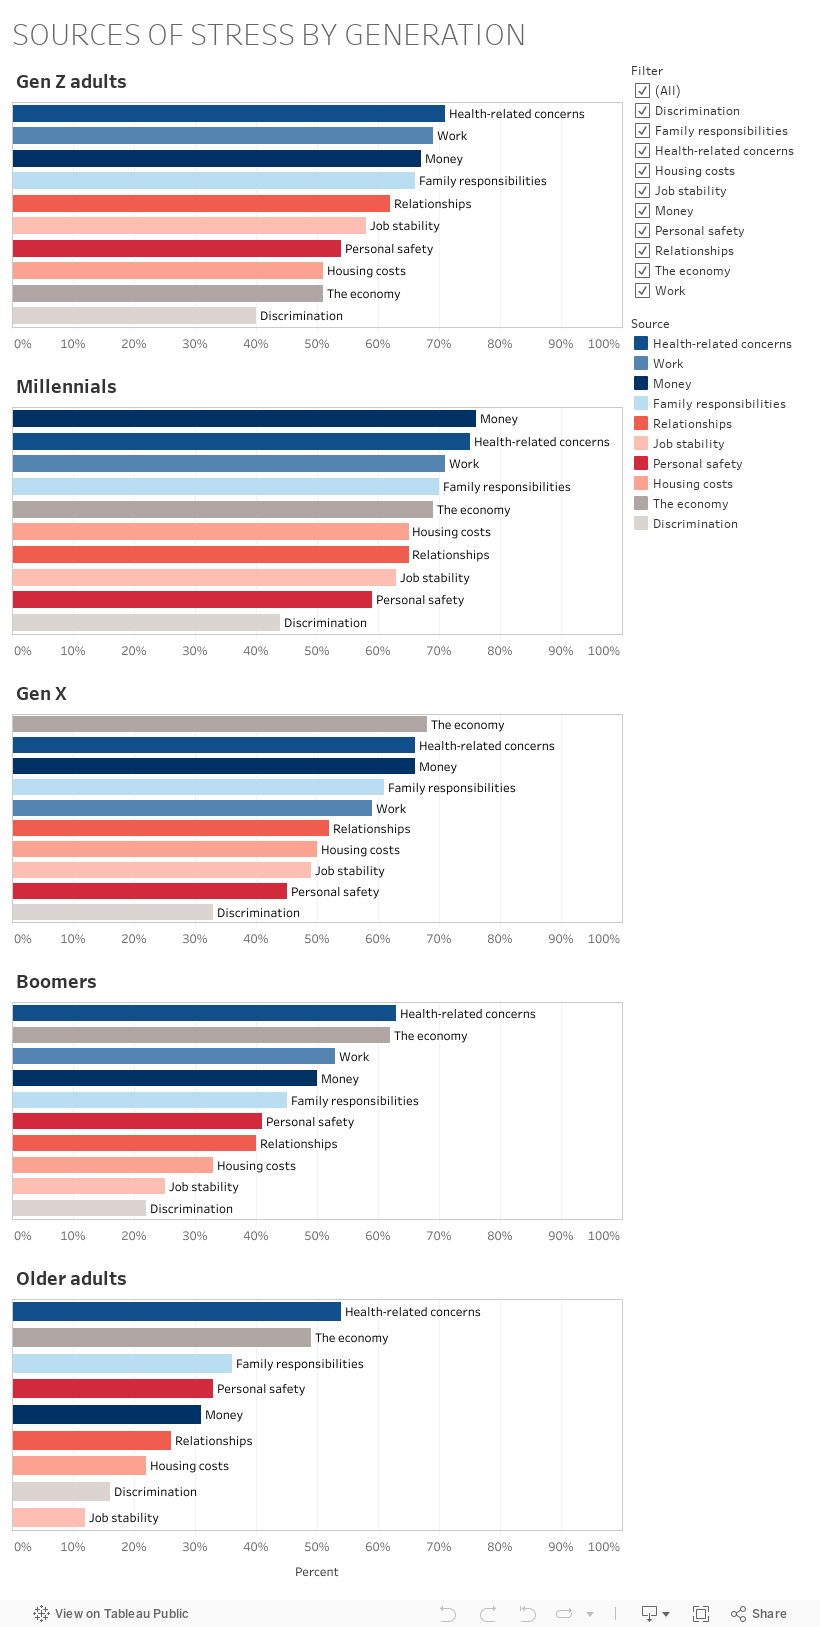
Use the “Filter” tool to narrow data by Gender, Generation, or Race, or click a category under the “Group” legend to highlight the data for that group. Hover over any point to view data. To see a larger version of the graphic, click on the "Enlarge" icon on the right, below the graphic.