

Thank you for your interest in data tools from APA's Center for Workforce Studies (CWS). CWS data tools present information on the psychology workforce and education pipeline. They are designed to be interactive and can generate custom tables and figures to answer your questions about the psychology workforce.
As the data tools contain a large amount of data, it usually takes a moment to load (speeds may be slower depending on your network). For the best user experience, we recommend using a desktop computer to access the data tools.
How to Interact with Graphics
If you are using a desktop, hover your mouse over the graphic to see more details about the data. If you are using a tablet or mobile device, click on the part of the graphics that you are interested in to see more details.
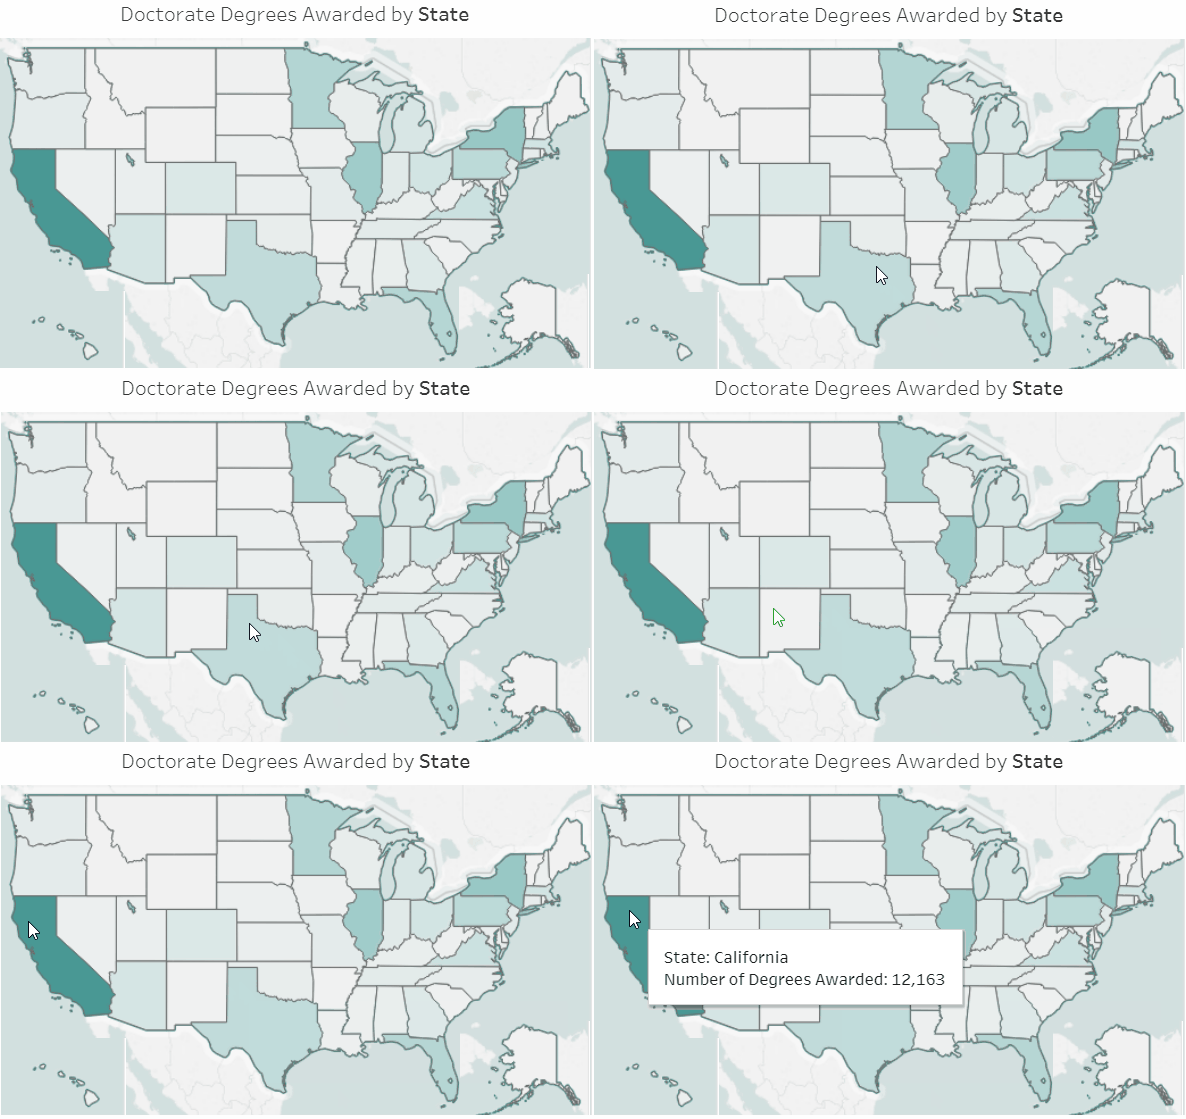
In the following example, you can see the numbers of psychology doctorate degrees awarded in Texas and California between 2006 and 2016 in the pop-up boxes by hovering your mouse over the states of Texas and California.
Isolating Specific Data
Some of the data tools isolate specific data inside a larger graphic.
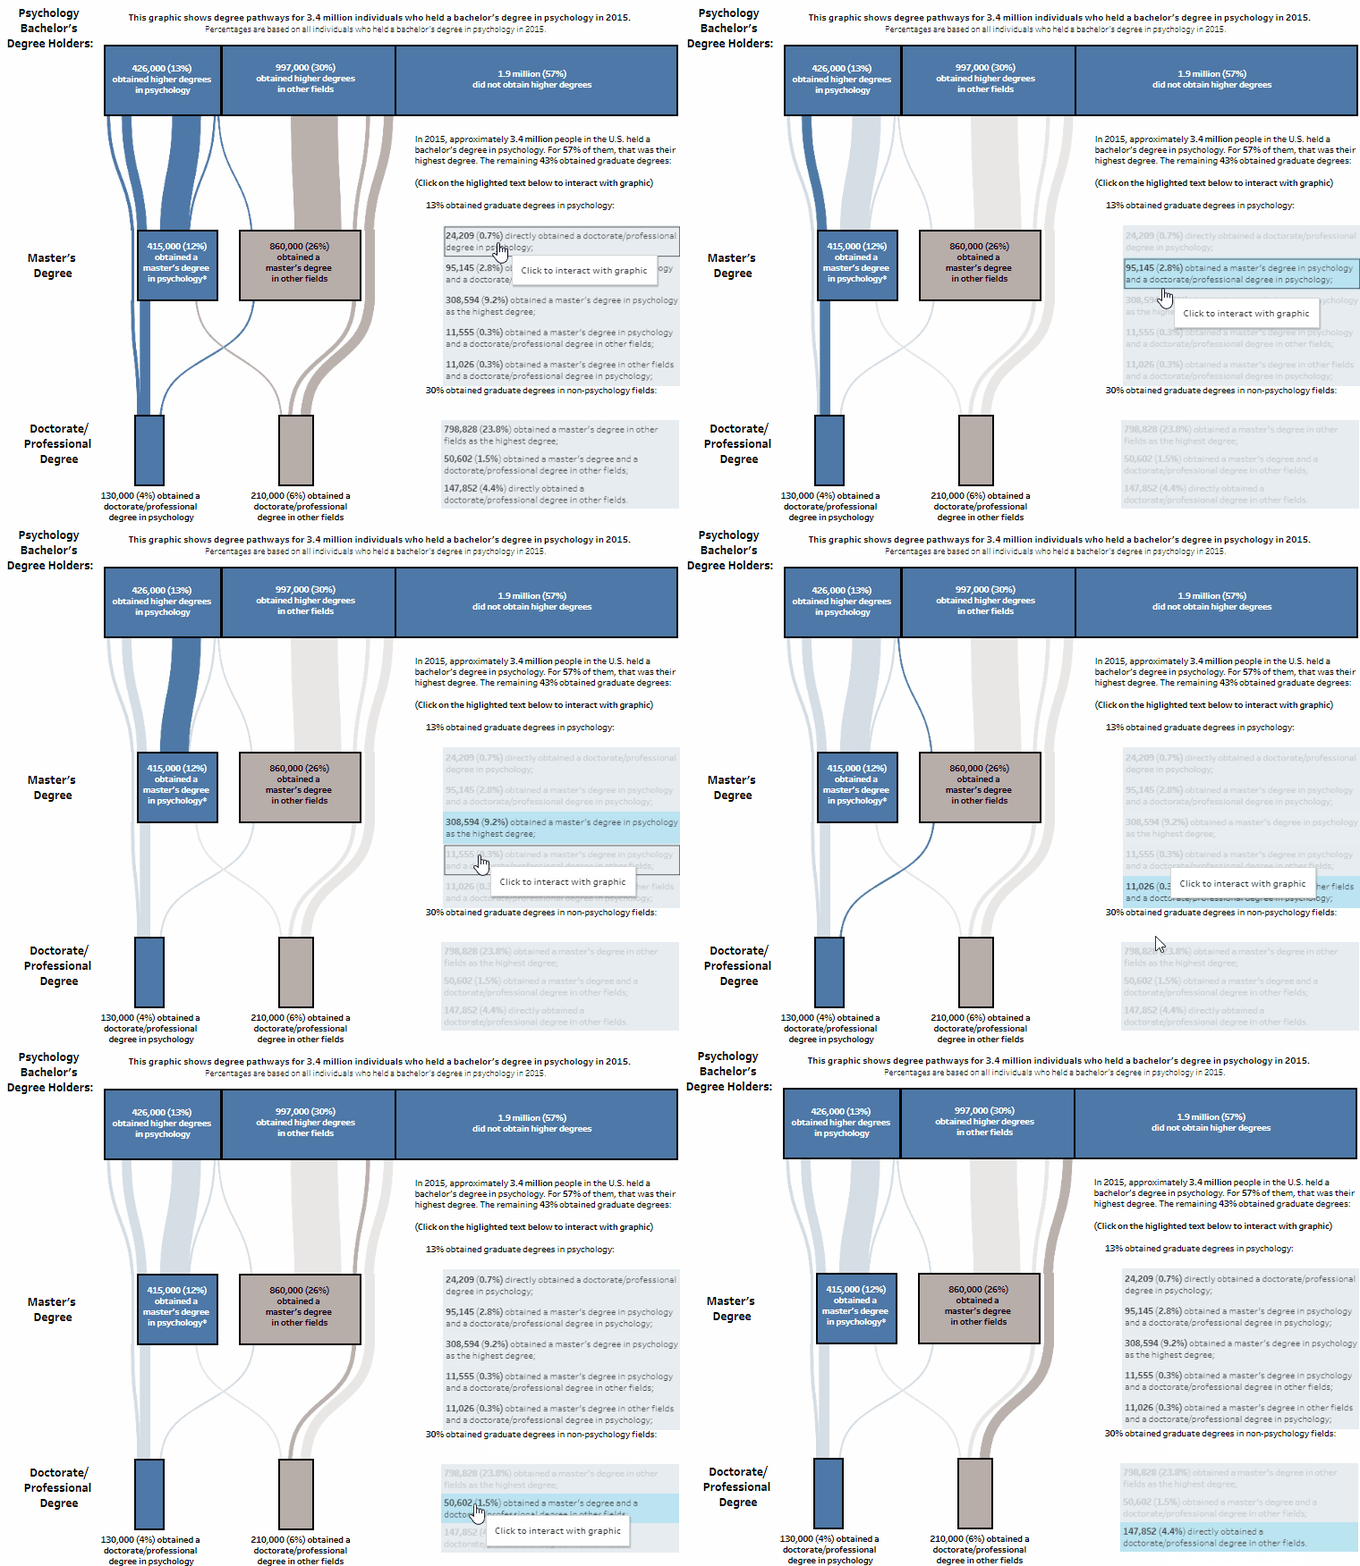
In the following example, clicking the text to the right highlights the corresponding degree pathway in psychology. You can highlight multiple parts of the graphic by selecting multiple sections of text while holding the "Ctrl" key. You can cancel the highlight by de-selecting the text.
The Dashboard Selector
Some of the data tools contain multiple dashboards across the top of the tool.
The following is an example of the dashboard selector for the "Degrees in Psychology".

How to Filter Data
Most of the data tools allow you to filter segments of the workforce, or to show a desired year. The data filter is usually located at the top of the data tool.
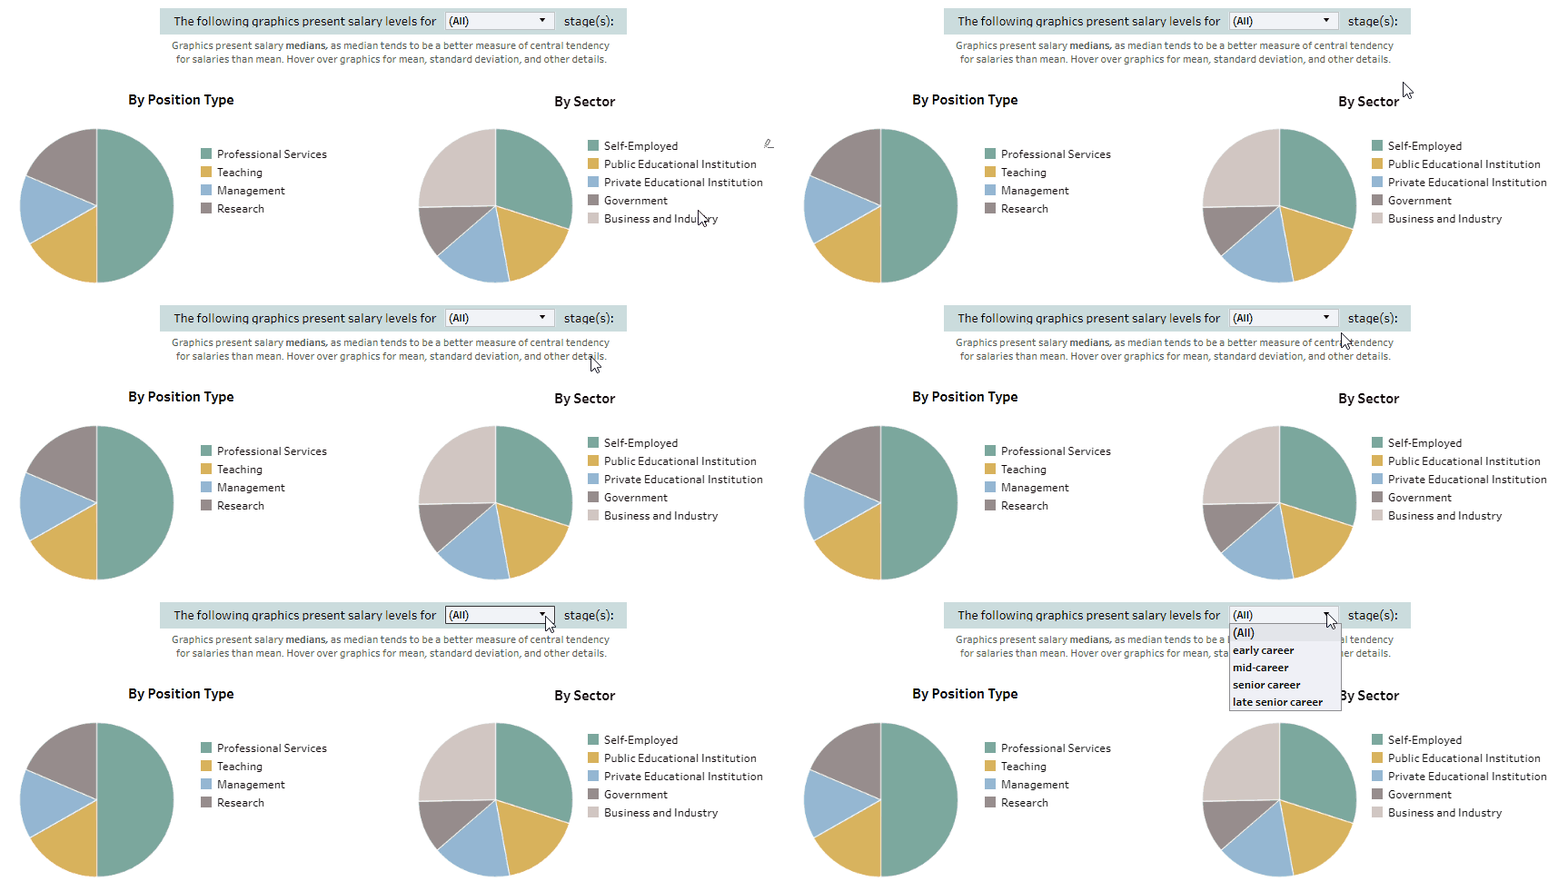
The following example shows a filter with a drop-down menu for psychologists by career stage. Once you make a selection, the graphics on the dashboard will change accordingly.
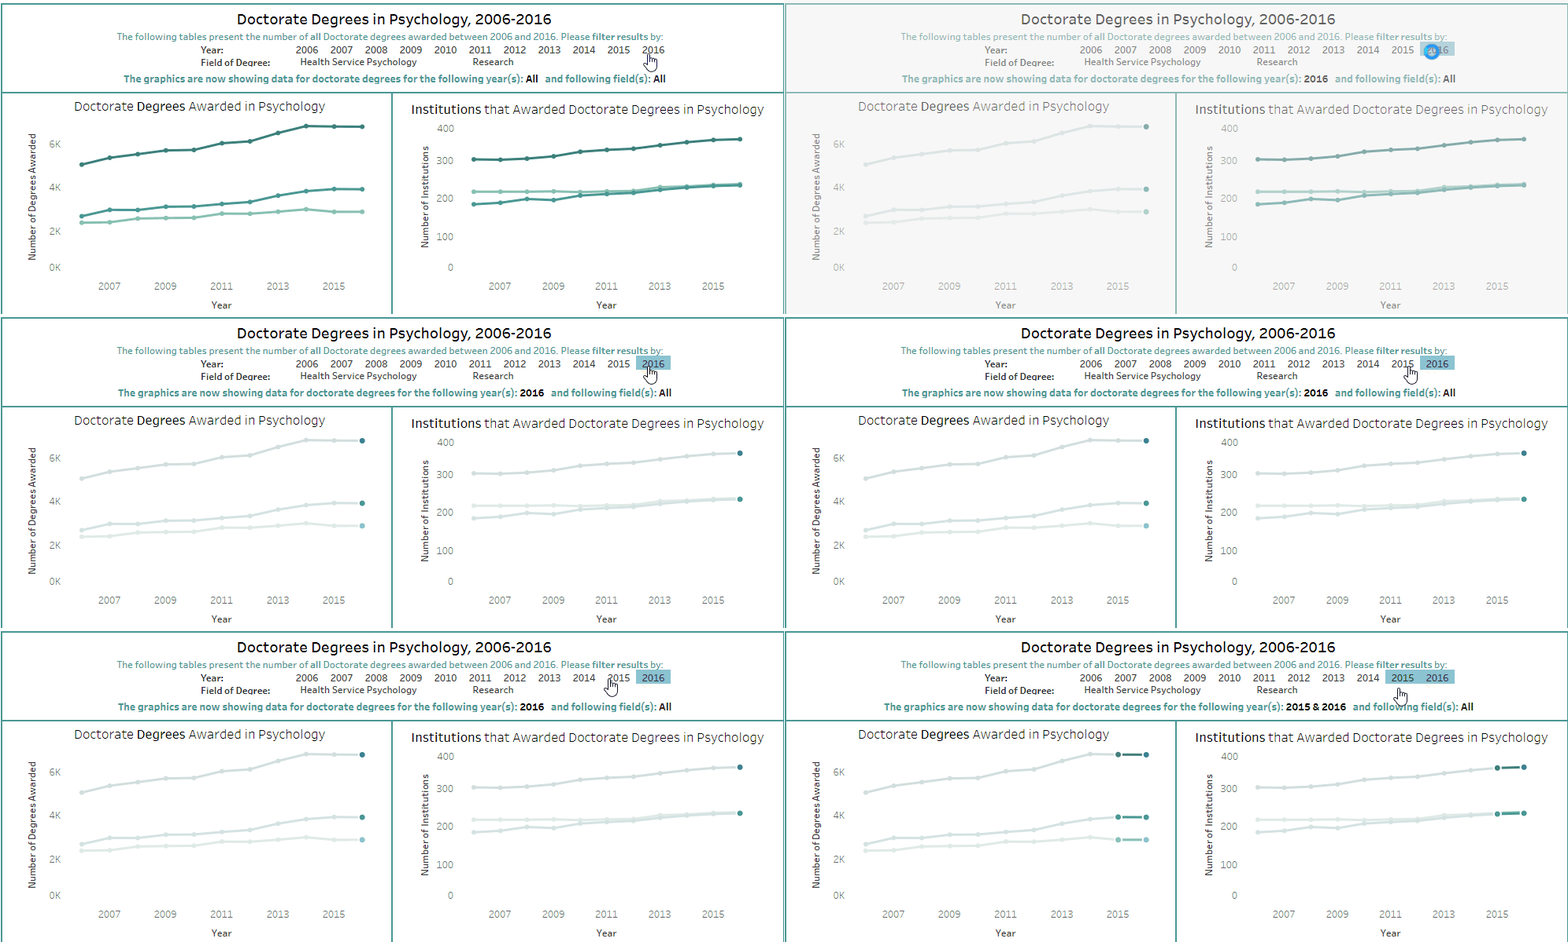
The following example shows a filter by year of awarding doctorate degree and another by field of degree in the "Degrees in Psychology" tool. You can select multiple years by clicking on the years while holding "Ctrl". In the screenshot below, the graphics indicate the numbers of psychology degrees in all fields awarded in 2015 and 2016.
How to Download Data
At the bottom-right corner, there are several icons (see screen shot below). The three icons to the right allow to undo, redo or reset actions to the data tool. The three icons to the left allow you to share, download the data tool, or view it full-screen.

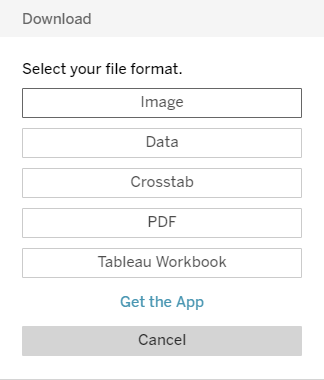
Once you click on the "download" icon (second one to the right), there are a few download options (see screen shot below).
- The "Image" option allows you to download the entire dashboard as a PNG file.
- The "Data" and "Crosstab" options allow you to download data underlying the data tool. To download the data underlying the graphics, you must first click on a graphic or a table before clicking on the "download" icon.
- The "Data" option allows you to view and download the micro-data underlying the graphic or table you selected as a CSV file.
- The "Crosstab" option allows you to download the data underlying the graphic or table you selected as summary statistics in a CSV file. We recommend using the "Crosstab" option to view and download data underlying the data tool. - The "PDF" option allows you to download the dashboard as a PDF file. You can customize the PDF output to show a specific figure or table on the dashboard, and adjust page scale, size, and orientation of the PDF output.
- The "Tableau Workbook" option allows you to download the entire data tool as a Tableau package. Opening the package requires the installation of the Tableau software.
Need More Details?
More detailed and technical notes are provided at the bottom of our data tools, including data sources, methodology and recommended citation. If you need more information, please contact us by email.