


Key Findings

Supply will meet or exceed baseline demand, demand under the Affordable Care Act and demand in the geographic equivalence scenario.

Psychologist supply is insufficient to meet unmet need or demand in the racial/ethnic equivalence scenario.

Increasing supply through more graduates and later retirement narrows but does not eliminate the gap between supply and demand.
Workforce projections examine current and projected psychologist supply and demand from 2015-30. This is the first independent workforce analysis commissioned by the American Psychological Association and conducted by IHS Markit. IHS Markit conducts health workforce studies for federal and state governments, associations, non-profit organizations and health systems. The projections are based on U.S. Census population projections, rosters of doctoral-level licensed psychologists, APA survey data on practice patterns and nationally representative federal surveys of service utilization. The projections include licensed, doctoral-level psychologists who were actively working and are described in terms of psychologists. A full-time equivalent (FTE) psychologist was defined as an individual who worked 39 hours per week, the national average of total work hours.
Supply was determined by the number of licensed psychologists who are active in the workforce, new entrants, workforce participation patterns and migration patterns. Demand was determined by current patterns of service utilization and projected population demographic changes. The starting point for the projections assumed supply and demand were equal. In 2015, the supply of psychologists was estimated to be 95,180.
Baseline scenarios projected supply and demand if current trends continue (i.e. for supply, current workforce patterns continue and for demand, current service utilization patterns continue). These scenarios focus on mental health services and may underestimate psychologists’ role in providing health services more broadly. Another demand scenario projected the effects of continued expansion of health insurance coverage under the Affordable Care Act. Hypothetical demand scenarios included a scenario addressing an estimated 20 percent unmet need for mental health services and two scenarios related to equity and barriers to care. A geographic equivalence scenario projected demand if individuals without health insurance in rural areas had service utilization patterns similar to insured individuals in metropolitan areas. A racial/ethnic equivalence scenario projected demand if the entire U.S. population had service utilization patterns similar to the insured non-Hispanic white population.
Fact Sheets
- Supply Scenarios for the Psychologist Workforceopens in new window (PDF, 157KB)
- Demand Scenarios for the Psychologist Workforceopens in new window (PDF, 175KB)
- Geographic Equivalenceopens in new window (PDF, 231KB)
- Racial/Ethnic Equivalenceopens in new window (PDF, 151KB)
- Unmet Needopens in new window (PDF, 154KB)
- Demand Across Age Groupsopens in new window (PDF, 276KB)
- Demand Across Racial/Ethnic Groupsopens in new window (PDF, 212KB)
- Demand Within the Hispanic Populationopens in new window (PDF, 212KB)
- Demand Within the Black/African-American Populationopens in new window (PDF, 212KB)
- Demand by Employment Settingopens in new window (PDF, 146KB)
- Geographic Patterns in Supply and Demandopens in new window (PDF, 388KB)
- Data Sourcesopens in new window (PDF, 178KB)
Download our summary for "Psychologist Workforce Projections: Addressing Supply and Demand from 2015-30" (PDF, 395KB).


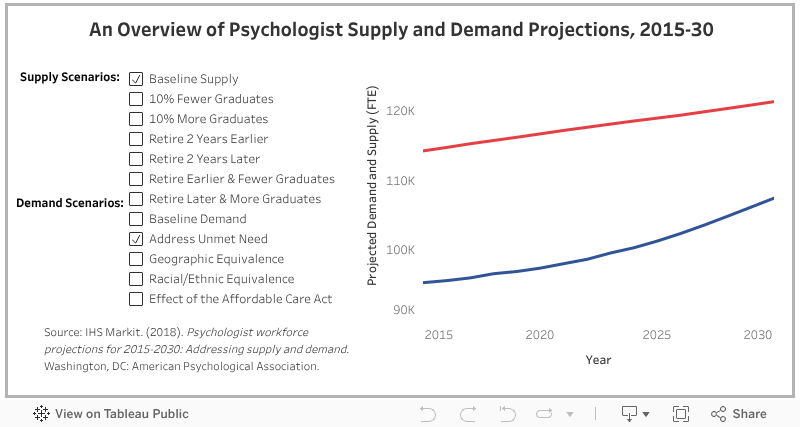
The data tool shows that psychologist supply and demand are roughly in balance and increase at similar rates through 2020. Around 2020, supply meets demand and begins to increase at a faster rate. Supply is sufficient to meet or exceed demand under some scenarios. In 2022, supply meets demand under the Affordable Care Act and in 2028 supply meets demand in the geographic equivalence scenario.
Psychologist supply is insufficient to meet demand in the racial/ethnic equivalence scenario or address the unmet need for psychological services. Even under supply scenarios where more graduates enter the workforce and psychologists retire later, supply is insufficient to meet demand in the racial/ethnic equivalence scenario or address unmet need for psychological services. The gap between supply and demand narrows but is not eliminated under these scenarios.
If racial/ethnic equivalence and unmet need were addressed, demand could increase substantially. By 2030, and the racial/ethnic equivalence scenario requires an additional 25,080 psychologists (above the 5,940 psychologist increase under baseline demand). Addressing unmet need requires an additional 20,220 psychologists.

Interactive State-level Map Tool

Limitations
The projections may underestimate demand, as they are based on available data from federal agencies and other sources. Generally, these sources rely on traditional definitions of psychologists as providers of mental health services that may not capture the broad range of psychological services. For example, psychologists’ expanding roles in addressing health conditions (e.g., obesity, smoking, pain management, chronic illnesses) and in more heterogeneous venues (e.g., primary care, integrated care) may not be sufficiently captured in these projections. Furthermore, federal data sources often characterize psychologists differently than the terms used by the profession. For example, the category “offices of health practitioners” includes offices of psychologists in private practice. In the psychologist workforce, private practice is the largest work setting and is often classified separately. Information about psychological services, populations, and service venues must be reviewed closely in making future projections.
The projections do not allow examination of detailed breakdowns in certain areas. While the projections include services delivered by specialty areas (such as neuropsychology or clinical health psychology) and in primary care settings, available data sources do not identify specialty areas or settings for psychologists.
Finally, demand was based on service utilization patterns rather than need. It is likely that the need for psychological services exceeds current service utilization patterns. The unmet need scenario suggested that this is the case. It is also likely that the underlying assumption that supply and demand are equal at the starting point (2015) does not account for current unmet need. However, the magnitude of these discrepancies is uncertain.
Conclusions and Implications
Workforce projections represent an important step in understanding the current and future workforce. While the psychologist workforce appears to be the right size nationwide, there are projected imbalances for certain populations and geographic areas. The projections suggest that the psychologist workforce will experience greater demand for services provided to older adults, Hispanic populations and in the South.
From 2015 to 2030, the national baseline demand for psychologists is projected to grow by 6 percent. Yet baseline supply of psychologists is projected to grow by 13 percent. The projected rates of growth differ because the population groups growing at faster rates historically used fewer psychological services.
A Road Map for Next Steps
These analyses represent a first step in projecting supply and demand in the psychologist workforce. The following next steps are recommended:

Address Unanswered Questions
While the current projection study addresses some key issues about the psychologist workforce such as size, geographic distribution and the ability to address unmet need, it leaves other questions in need of further and more refined study. It leaves other questions unresolved, such as does the workforce have the right specialty training? How can we examine primary care, health services (as opposed to mental health services), and other more precise categorizations of the work that psychologists do? Future projections may address these questions as well as variations in practice patterns.

Address limitations
Review the data sources used in the projections. For example, the National Provider Identifier (NPI) registry has a healthcare provider taxonomy, which may prove useful in estimating the number of psychologists in specialty areas. Some federal surveys contain mental health screening questions, which could be used as an additional indicator of unmet need. Incorporate national epidemiological data to be more precise about psychologists’ role in health. Use surveys to fill in data gaps.

Provide comments on federal statistical data collection efforts
Monitor Federal Register data collection notices. Provide feedback on how to better measure psychologists’ roles in health and health-related behaviors. Encourage adoption of survey questions on integrated care and the changing nature of health care delivery.

Nominate psychologists to serve on governmental advisory committees
Federal agencies, such as the National Center for Health Statistics, the Agency for Healthcare Research and Quality, and the Health Resources and Services Administration, often have advisory committees that provide guidance on surveys, research, and technical issues. This is a long-term mechanism to enable more precise data collection on psychologists’ role in health.

Develop comprehensive strategies for tracking licensed psychologists across all jurisdictions
Work with the Association of State and Provincial Psychology Boards (ASPPB) and state licensing boards to periodically track the workforce of licensed psychologists. Although state regulations present barriers in collecting workforce data, efforts exist for data sharing between ASPPB and APA. The minimum dataset for psychologists also represents the potential for long-term workforce tracking. Linking to other data sources, such as the NPI registry, may be beneficial.
Technical Reportopens in new window
Download the Technical Report for "Psychologist Workforce Projections: Addressing Supply and Demand from 2015-30" (PDF, 1.1MB) for more details about the methods and results.
References
- Association of American Medical Colleges. (2018). The Complexities of Physician Supply and Demand: Projections from 2016 to 2030. Washington, DC: Author. Retrieved from https://aamc-black.global.ssl.fastly.net/production/media/filer_public/bc/a9/bca9725e-3507-4e35-87e3-d71a68717d06/aamc_2018_workforce_projections_update_april_11_2018.pdfopens in new window
- Substance Abuse and Mental Health Services Administration. (2017). Results from the 2016 National Survey on Drug Use and Health: Detailed Tables. [Table 8.53B]. Retrieved from https://www.samhsa.gov/data/sites/default/files/NSDUH-DetTabs-2016/NSDUH-DetTabs-2016.htm#intro_ftn16opens in new window
- U.S. Department of Health and Human Services, Health Resources and Services Administration, National Center for Health Workforce Analysis. (2017). National and regional supply and demand projections of the nursing workforce: 2014-2030. Rockville, Md.; Author. Retrieved from https://bhw.hrsa.gov/sites/default/files/bhw/nchwa/projections/NCHWA_HRSA_Nursing_Report.pdfopens in new window