



Since 2007, the Stress in America™ survey has examined how stress affects Americans’ health and well-being. This year, survey findings show that although overall stress levels appear to be trending downward, this drop is not shared equally. Those groups that consistently struggle with stress — women, younger Americans and parents — continue to report higher stress levels and are more likely to report that they have experienced at least one symptom of stress in the past month than Americans overall.
Regardless of group, Americans continue to report stress at levels higher than what they believe is healthy, struggle to achieve their health and lifestyle goals, and manage stress in ineffective ways.
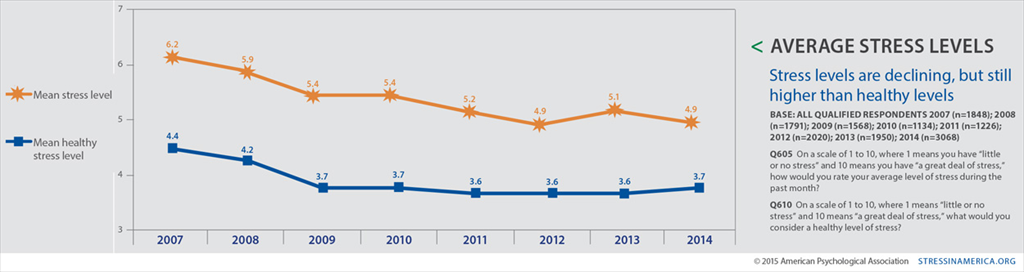
Although survey findings show that average stress levels have decreased since 2007, many Americans say they struggle to achieve their healthy living goals and that important health behaviors like eating and sleeping are affected by stress. Only a small percentage say their stress has actually decreased this past year.
- On average, Americans rate their stress level as 4.9 on a 10-point scale, where 1 is “little or no stress” and 10 is “a great deal of stress,” down from 6.2 in 2007.
- Despite this downward trend, reported stress levels remain higher than what Americans believe to be healthy — 3.7 on a 10-point scale — though the gap between average reported stress levels and healthy stress levels is narrowing (a gap of 1.2 in 2014 vs. 1.8 in 2007).
- Forty-two percent of adults say they are not doing enough or are not sure whether they are doing enough to manage their stress. One in 5 Americans (20 percent) say they never engage in an activity to help relieve or manage their stress.
- Many Americans say their stress levels have either stayed the same (53 percent) or increased (29 percent) in the past year. Only 18 percent of Americans say their stress has decreased in the past year.
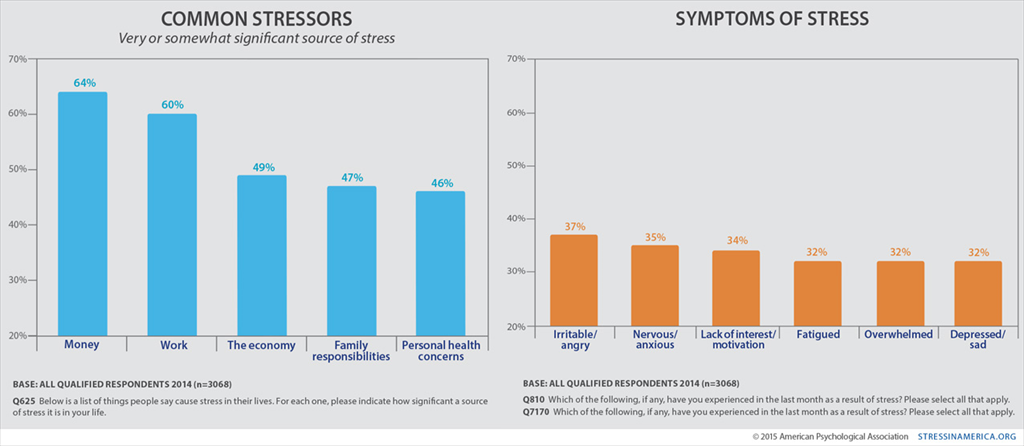
- The most commonly reported sources of stress include money (64 percent report that this is a very or somewhat significant source of stress), work (60 percent), the economy (49 percent), family responsibilities (47 percent) and personal health concerns (46 percent).
- The most commonly reported stress management techniques include listening to music (44 percent), exercising/walking (43 percent), watching television for more than two hours per day (40 percent) and surfing the Internet/going online (38 percent).
Stress remains a barrier that prevents people from living well and reaching their health and lifestyle goals.
- The number of Americans saying that stress has a very strong or strong impact on their physical (25 percent in 2014 vs. 37 percent in 2011) or mental health (28 percent in 2014 vs. 35 percent in 2011) appears to be declining.1 However, 75 percent of Americans report experiencing at least one symptom of stress in the past month.
- The most commonly reported symptoms of stress in the past month include feeling irritable/angry (37 percent), being nervous/anxious (35 percent), having a lack of interest/motivation (34 percent), feeling fatigued (32 percent), feeling overwhelmed (82 percent) and being depressed/sad (32 percent).
- A sizable number of Americans say that they engage in unhealthy behaviors because of stress, such as lying awake at night (42 percent say they have done this in the past month because of stress) or eating too much/eating unhealthy foods (33 percent say they have done this in the past month because of stress).
- Of those who have tried to make a lifestyle change in the past five years, many are still trying to lose weight (58 percent), reduce stress (53 percent), eat a healthier diet (49 percent), get more sleep (47 percent) and exercise more (45 percent).
- Willpower is the most commonly cited barrier to making lifestyle changes (32 percent of Americans say that a lack of willpower prevented them from making a change), but more than 1 in 10 say that they are too stressed to make a desired change (12 percent). In addition, 29 percent say that in the last month, stress has gotten in the way of exercising.
- Stress appears to affect relationships as well — 41 percent of adults who are married or living with a partner say that they lost patience or yelled at their spouse or partner due to stress in the past month and 18 percent of those who are employed say they snapped at or were short with a coworker.
- Stress also has gotten in the way of people taking care of their responsibilities at home in the last month (26 percent).
The Stress in America survey consistently finds that women report higher stress levels than men and are more likely than men to say they experience symptoms of stress and that they engage in unhealthy and sedentary behaviors to manage their stress.2 In fact, it appears that the gap between men’s and women’s stress levels has grown, and women are not faring any better when it comes to stress management.
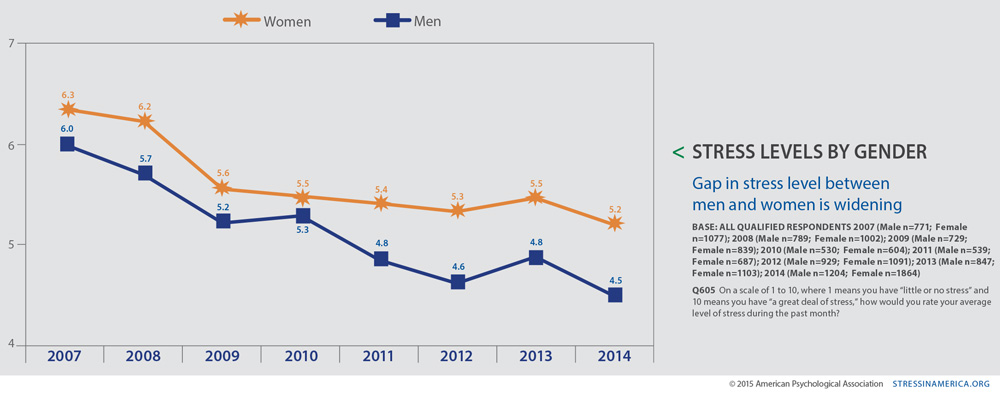
- On average, women continue to report a higher level of stress than men (5.2 vs. 4.5 on a 10-point scale in 2014, compared with 6.3 vs. 6.0 in 2007).
- More women than men say that their stress has increased in the past year (32 percent vs. 25 percent).
- Women are more likely than men to report money (68 percent vs. 61 percent) and family responsibilities (55 percent vs. 39 percent) as very or somewhat significant sources of stress.
- Despite men reporting lower stress levels and being less likely to report symptoms of stress, men are more likely than women to say they never engage in an activity to help relieve or manage their stress (22 percent of men vs. 18 percent of women).
- Women are also more likely than men to say they have experienced symptoms of stress in the past month, such as feeling as though they could cry (44 percent vs. 13 percent of men), being nervous/anxious (40 percent vs. 29 percent of men), feeling overwhelmed (40 percent vs. 24 percent of men), being depressed/sad (38 percent vs. 25 percent of men), feeling fatigued (37 percent vs. 27 percent of men) and constant worrying (35 percent vs. 20 percent of men).
- Far more women than men say they have lain awake at night in the past month due to stress (51 percent vs. 32 percent of men).
- Women are also more likely than men to say their eating habits are affected by stress. Forty-one percent say they have eaten too much/eaten unhealthy foods because of stress in the past month, compared with 24 percent of men, and 30 percent say they have skipped a meal because of stress in the past month, compared with 20 percent of men.
- Women are more likely than men to say they felt a sense of loneliness/isolation in the past month due to stress (29 percent vs. 19 percent of men).
- More women than men say that stress prevented them from making a lifestyle change (14 percent vs. 9 percent of men).
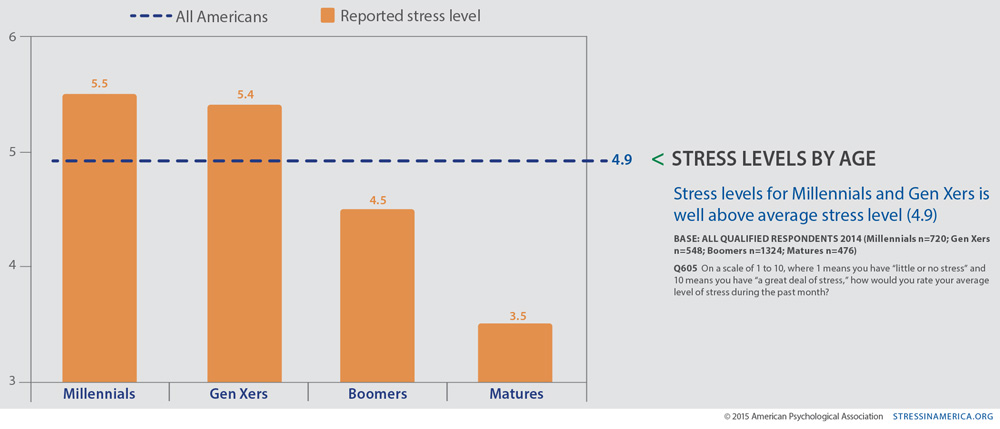
Survey findings suggest a connection between stress and age. Millennials and Gen Xers report a higher level of stress than any other generation and appear to have difficulty coping, while older people report lower stress. In addition, many millennials say they feel isolated/lonely due to stress, even though they report having a number of close personal relationships (4.8 is the reported average number of “close friends” that millennials say they feel at ease with, can talk to about personal matters and can call on for help).
- Millennials and Gen Xers report the highest levels of stress per generation (5.5 on a 10-point scale for millennials vs. 5.4 for Gen Xers, 4.5 for boomers and 3.5 for matures).
- Millennials are the most likely of all generations to say their stress has increased in the past year (36 percent vs. 30 percent of Gen Xers, 24 percent of boomers and 19 percent of matures).
- Millennials are more likely than any other generation to say they have felt a sense of loneliness/isolation due to stress in the past month (34 percent vs. 24 percent of Gen Xers, 21 percent of boomers and 12 percent of matures).
- More than four-fifths of millennials (82 percent) say they have experienced at least one symptom of stress in the past month (compared with 79 percent of Gen Xers, 70 percent of boomers and 62 percent of matures).
- Millennials are more likely than other generations to say that stress has a very strong or strong impact on their physical (30 percent vs. 27 percent of Gen Xers, 25 percent of boomers and 12 percent of matures) and mental health (37 percent vs. 33 percent of Gen Xers, 23 percent of boomers and 11 percent of matures).
- Millennials appear to rely on more sedentary stress management techniques than other generations, such as listening to music (57 percent vs. 42 percent of Gen Xers, 39 percent of boomers and 29 percent of matures), watching television for more than two hours per day (44 percent vs. 37 percent of Gen Xers, 42 percent of boomers and 35 percent of matures) and surfing the Internet/going online (46 percent vs. 33 percent of Gen Xers, 37 percent of boomers and 31 percent of matures).
- More than half of millennials say they have lain awake at night in the past month due to stress (51 percent compared with 45 percent of Gen Xers, 37 percent of boomers and 27 percent of matures).
- More than one-third of millennials say their eating habits are affected by stress:
- Forty-one percent say they have eaten too much/eaten unhealthy foods because of stress in the past month versus 35 percent of Gen Xers, 29 percent of boomers and 21 percent of matures.
- Thirty-four percent say they have skipped a meal because of stress in the past month versus 26 percent of Gen Xers, 22 percent of boomers and 11 percent of matures.
Survey findings suggest that parents — defined as those with children under the age of 18 living at home — have a more challenging relationship with stress than Americans overall. They report higher average stress levels than their counterparts and are more likely to say that their stress is impacting their physical health as well as their emotional well-being.
- Parents report higher average stress levels than nonparents (5.7 vs. 4.7 on a 10-point scale).3 In addition, parents are more likely to say their stress has increased in the past year (34 percent vs. 27 percent of nonparents).
- More parents than nonparents say they are not doing enough to manage their stress (31 percent vs. 20 percent).
- Parents are more likely than nonparents to cite money (77 percent vs. 60 percent), family responsibilities (65 percent vs. 42 percent) and housing costs (54 percent vs. 36 percent) as very or somewhat significant sources of stress.
- Parents are more likely than nonparents to say they have experienced at least one physical symptom of stress in the past month (77 percent vs. 68 percent).
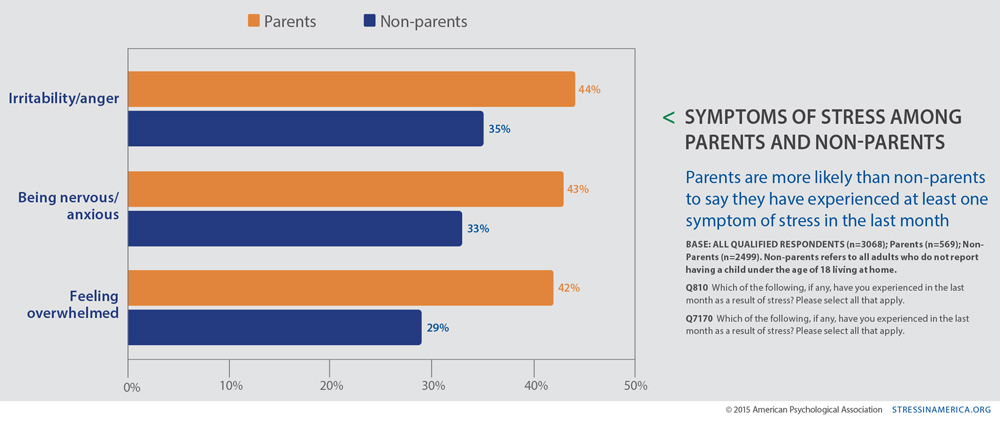
- Some symptoms of stress that parents report include irritability/anger (44 percent vs. 35 percent), being nervous/anxious (43 percent vs. 33 percent) and feeling overwhelmed (42 percent vs. 29 percent).
- Nearly half of parents (49 percent) say they lost patience with their children in the past month when they were feeling stressed.
- Although parents are as likely as nonparents to say they are in excellent/very good health (38 percent vs. 37 percent), they are more likely to say that stress has a very strong/strong impact on their physical (31 percent vs. 24 percent) and mental health (36 percent vs. 26 percent).
- Parents are more likely than nonparents to report engaging in unhealthy stress management techniques, such as drinking alcohol (18 percent vs. 12 percent) and smoking (17 percent vs. 10 percent).
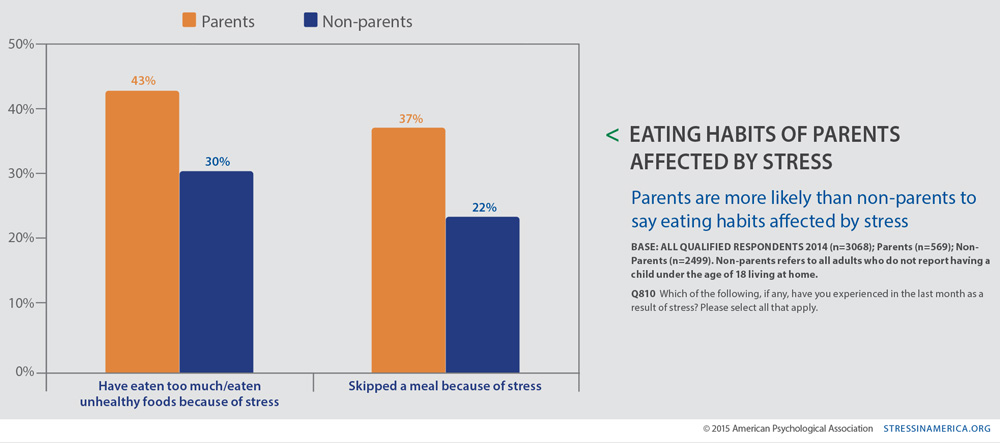
- Far more parents than nonparents say they have lain awake at night in the past month due to stress (51 percent vs. 39 percent). Parents are also more likely than nonparents to say their eating habits are affected by stress:
- Forty-three percent say they have eaten too much/eaten unhealthy foods because of stress in the past month versus 30 percent of nonparents.
- Thirty-seven percent say they have skipped a meal because of stress in the past month versus 22 percent of nonparents.
- More parents than nonparents say that stress prevented them from making a lifestyle change (16 percent vs. 11 percent of non parents).
Comparing East, Midwest, West and South regions, Americans report similar levels and sources of stress.4 Regardless of where they live, Americans’ experiences with stress appear to be similar.
- Adults report comparable levels of stress on a 10-point scale in each region of the country (East: 4.9; Midwest: 4.9; West: 4.8; South: 5.0).
- The most commonly reported sources of stress are the same across all regions: money (East: 67 percent; Midwest: 63 percent; West: 60 percent; South: 66 percent), work (East: 59 percent; Midwest: 57 percent; West: 66 percent; South: 59 percent) and the economy (East: 50 percent; Midwest: 48 percent; West: 46 percent; South: 52 percent).
- Similar numbers of Americans in each region rate their overall health as excellent/very good (East: 40 percent; Midwest: 36 percent; West: 36 percent; South: 38 percent). People’s awareness of the impact that stress has on their physical and mental health is also consistent across regions:
- Those reporting that stress has a strong/very strong impact on physical health: East: 24 percent; Midwest: 24 percent; West: 25 percent; South: 27 percent.
- Those reporting that stress has a strong/very strong impact on mental health: East: 25 percent; Midwest: 27 percent; West: 31 percent; South: 28 percent.
12011 is the first year that Q7180 (How much of an impact do you think your stress level has on your body/physical health?) and Q7185 (How much of an impact do you think your stress level has on your mental health?) were fielded as part of the Stress in America survey.
2Multiple linear regression was used in order to determine whether there were significant differences in how various subgroups changed over time. Read the full methodology here.
3Nonparents refers to all adults who do not report having a child under the age of 18 living at home. BASE: Parents (n=569); nonparents (n=2499).
4BASE: East (n=670); Midwest (n=776); West (n=637); South (n=984).