

A wealth of psychological research shows that discrimination can exacerbate stress. Moreover, discrimination-related stress is linked to mental health issues, such as anxiety and depression, even in children.1,2 In this year’s examination of the state of Stress in America™, the American Psychological Association (APA) highlights the connection between discrimination and stress, along with the resulting impacts on relationships, employment and overall health.
2015 Stress in America™
expand all
Experiencing Discrimination in America
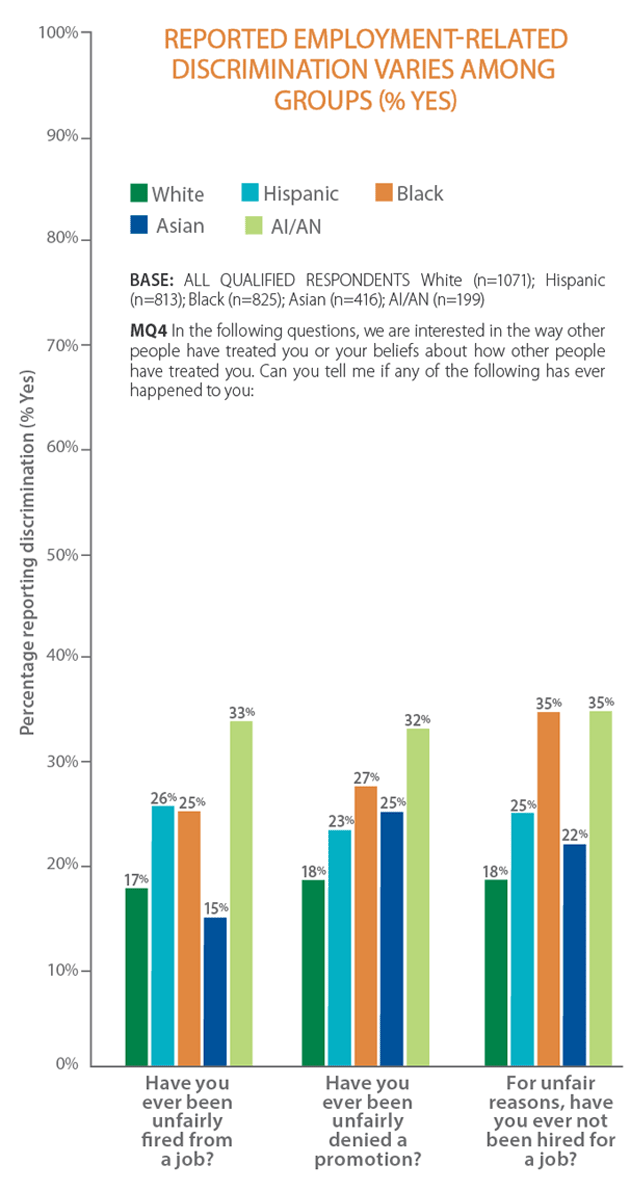 Nearly seven in 10 adults (69 percent) in the U.S. report having experienced any discrimination, with 61 percent reporting experiencing day-to-day discrimination, such as being treated with less courtesy or respect, receiving poorer service than others, and being threatened or harassed . Within this report, discrimination is reported across subgroups of adults, including age, race or ethnicity3, disability, gender, sexual orientation and gender identity. For example, adults with a disability are twice as likely as adults without a disability to say that their life has been harder (a lot or some) because of discrimination and that discrimination has interfered with them being able to live a full and productive life4 (for both references: 19 percent of adults with a disability vs. 9 percent of adults without a disability).5 For all groups surveyed, the most commonly reported experiences of major discrimination relate to employment.
Almost half of all adults (47 percent) report experiencing major forms of discrimination, which include police unfairly stopping, searching, questioning, physically threatening or abusing them; neighbors making life difficult for them or their family upon moving into a neighborhood; a teacher or advisor discouraging them from continuing their education; or experiencing unfair treatment when receiving health care.
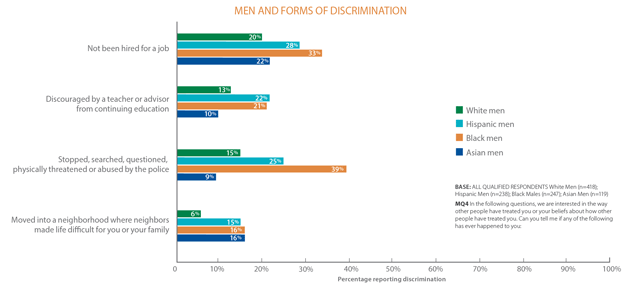
• Nearly two in five Black men (39 percent vs. 19 percent of all men) say that police have unfairly stopped, searched, questioned, physically threatened or abused them. More than one in three Asian men report being unfairly denied a promotion (35 percent vs. 24 percent of all men).
• At least 7 in 10 American Indian/Alaska Natives (AI/AN) (81 percent), Blacks (76 percent), Asians (74 percent) and Hispanics (72 percent) report having experienced everyday discrimination, such as being treated with less courtesy or respect, being treated as if they are not smart or receiving poorer service than others, compared to 61 percent of all adults.
• Thirty-four percent of (AI/AN), 23 percent of Blacks, 19 percent of Hispanics, 11 percent of Whites and 11 percent of Asians report experiencing these slights almost every day or at least once a week.
• While Black (71 percent), Asian (64 percent), Hispanic (56 percent) and AI/AN (36 percent) adults report that race is the main reason they think they experienced day-to-day discrimination, White adults overall are most likely to attribute the experience to age (33 percent).
• Around half or more Black (60 percent), AI/AN (50 percent), Asian (49 percent) and Hispanic (45 percent) adults say their lives have been at least a little harder because of discrimination, with one in 10 AI/AN and nearly the same percentage of Black adults (8 percent) saying it has made life a lot harder.
• Nearly one-quarter of adults who are LGBT (23 percent) say that they have been unfairly stopped, searched, questioned, physically threatened or abused by the police. This group of adults also reports being unfairly not hired for a job (33 percent) and being unfairly discouraged by a teacher or advisor to continue their education (24 percent).5
• Younger adults are the most likely to say they have experienced any discrimination (75 percent of millennials, compared to 72 percent of Gen Xers, 67 percent of boomers and 56 percent of matures).6
• Thirty percent of women cite gender as a reason for day-to-day discrimination, compared to just 8 percent of men.
Discrimination Associated With Higher Stress Levels and Health Disparities
Regardless of the cause, experiencing discrimination is associated with higher reported stress and poorer reported health. While average reported stress levels in the United States have seen a slight increase in the past two years (5.1 in 2015 and 4.9 in 2014 on a 10-point scale, where 1 is “little or no stress” and 10 is “a great deal of stress”), some segments of the population are more likely to report experiencing higher average stress levels.
- For many adults, dealing with discrimination results in a state of heightened vigilance and changes in behavior, which in itself can trigger stress responses — that is, even the anticipation of discrimination is sufficient to cause people to become stressed.7 AI/AN adults are most likely (43 percent) to take care about what they say and how they say it, as well as to avoid certain situations, to cope with day-to-day discrimination. Hispanic and Black adults (31 percent and 29 percent, respectively) are most likely to say they feel a need to take care with their appearance to get good service or avoid harassment. Many adults also report trying to prepare for possible insults from other people before leaving home (25 percent of AI/AN, 23 percent of Blacks, 21 percent of Hispanics and 15 percent of Asians and Whites).
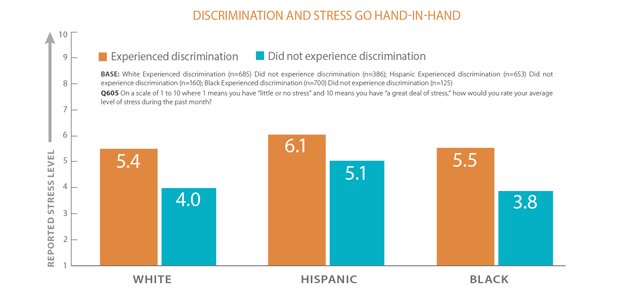
- Adults who are LGBT who have experienced discrimination have average stress levels of 6.4, compared to 6.0 for LGBT adults overall. Among adults who are non-LGBT, stress levels are 5.5 for those who have experienced discrimination and 5.0 for non-LGBT adults overall. This also is seen across racial groups: Average stress levels of those reporting discrimination (6.1 on a 10-point scale for Hispanics, 5.5 for Blacks and 5.4 for Whites) were higher than for those not reporting it (5.1 for Hispanics, 3.8 for Blacks and 4.0 for Whites).
- Among generations, the discrimination/stress divide can be seen within the larger population of millennials.8 More than half of Asian millennials (51 percent) and 47 percent of Black millennials say that discrimination is a very or somewhat significant source of stress, compared to 31 percent of Hispanic and 26 percent of White millennials reporting the same.
- More than one in 10 adults (13 percent) say they have been treated unfairly when receiving health care, and significantly more AI/AN adults (28 percent) report experiencing discrimination when receiving health care treatment.
- Adults with disabilities are more likely than those without a disability to say discrimination is a somewhat or significant source of stress (26 percent vs. 18 percent).
- Almost half of adults who did not report experiencing discrimination (45 percent) report excellent or very good health, compared to 31 percent who report experiencing discrimination. Forty-six percent of Whites who say they have not experienced discrimination report excellent/very good health, while only 34 percent of Whites who have experienced discrimination report excellent/very good health (Hispanics: 37 percent vs. 29 percent; Blacks: 32 percent vs. 28 percent, respectively).
Despite the stress, the majority of adults who report experiencing discrimination (59 percent) feel that they have dealt quite well or very well with it and any resulting changes or problems.
- Younger adults are less likely than older generations to report having dealt well with discrimination. Sixty-one percent of boomers and 86 percent of matures report that they have dealt quite well or very well with having experienced discrimination and any resulting changes or problems, compared to about half of younger adults (51 percent of millennials and 53 percent of Gen Xers) saying the same.
- Forty percent of adults who are LGBT say they have dealt quite well or very well with having experienced discrimination and any resulting changes or problems, while 60 percent of non-LGBT adults say the same.
- Having emotional support appears to improve the way that individuals view their coping abilities with discrimination. Sixty-five percent of adults overall who say they experienced discrimination and indicate that they had emotional support also say they coped quite or very well, compared to 37 percent of those who report not having emotional support.
- Differences by racial and ethnic groups also reveal that higher percentages of those who say they experienced discrimination and indicate they had emotional support said they coped quite or very well, compared to those who report not having support. For Whites, 69 percent of those who say they experienced discrimination and indicate that they had emotional support report coping quite or very well, compared to 36 percent of those who report not having emotional support (Blacks: 63 percent vs. 30 percent; Hispanics: 54 percent vs. 38 percent).
All groups appear to do better when they have emotional support. Those who indicate that they did not have emotional support also report higher stress levels (6.3 average level on a 10-point scale compared to 5.0 for people with emotional support). Across population groups, average stress levels of those without support (6.8 for Hispanics, 6.3 for Blacks and 6.2 for Whites) were higher than for those with emotional support (5.7 for Hispanics, 5.1 for Blacks and 4.9 for Whites).
The Health Disparities and Stress Connection
While overall life expectancy at birth in the United States reached a record high in 2012, significant numbers of adults across different subgroups also are experiencing disproportionate rates of health disparities, including mortality rates.9 The results from this year’s Stress in America™ survey also suggest that stress is a significant health disparity in itself, and stress also may be associated with other health disparities.
Nearly one-quarter of adults (23 percent) report that their health is “fair” or “poor,” and one in five (20 percent) report being diagnosed as overweight. Among certain subgroups, the percentage reporting “fair” or “poor” health is significantly greater than adults overall, and other health disparities emerge among these groups.
- More than one-quarter of AI/AN (39 percent), Blacks (30 percent) and Hispanics (29 percent) report that they are in fair or poor health, compared to 23 percent of adults overall.
- More than two-fifths of those who say they have been diagnosed with a chronic illness (42 percent) report also having a disability, compared with only 17 percent of those who do not have a chronic illness. One-third of adults overall (33 percent) report having a disability, with the highest percentages of AI/AN (44 percent) and Whites (36 percent) reporting this, followed by Blacks (30 percent), Hispanics (28 percent) and Asians (20 percent).
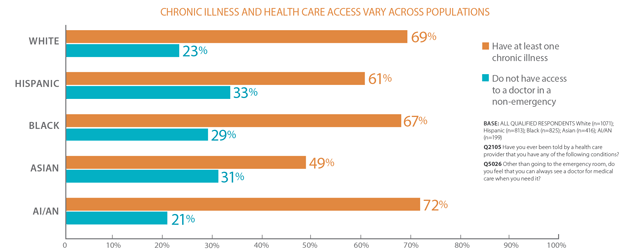
- Rates of having received at least one chronic illness diagnosis are consistent across most sub-group populations, with almost seven in 10 (67 percent) of all adults saying that they have received a chronic illness diagnosis, including mental health-related conditions.
- Rates of health care access, however, differ widely. Hispanics are the most likely to report that they do not have access to a non-emergency doctor when they need it (33 percent), followed by 31 percent of Asians, 29 percent of Blacks, and significantly fewer Whites (23 percent) and AI/AN (21 percent). Rates of health care insurance coverage also differ across groups: 20 percent of Hispanics report having no health insurance, followed by 15 percent of Blacks, 14 percent of AI/AN, 6 percent of Asians and 5 percent of Whites.
Research shows a connection between poor health and chronic stress, and this year’s survey findings seem to corroborate this connection.10,11 Among all adults, those who report experiencing extreme levels of stress (a rating of 8, 9 or 10 on a 10-point scale) are twice as likely to report fair or poor health, compared to those with low stress levels.
- Adults who report being in fair or poor health have higher average stress levels than those who report being in excellent or very good health (5.9 vs. 4.6 on a 10-point scale).
- Nearly half (46 percent) of Black adults who rate their stress as high extreme (46 percent) report fair or poor health, while only 22 percent who report low stress levels say the same. One in three (35 percent) Hispanics who report having extreme high stress (35 percent) also report being in fair or poor health, compared to 19 percent of Hispanics reporting low stress.
About half of adults who are LGBT (49 percent) report that their stress has increased, whereas only 34 percent of adults who are not LGBT say the same. In addition, adults who are LGBT also are less likely than adults who are non-LGBT to report that they are in very good or excellent health (24 percent and 36 percent, respectively).
Stress Levels Reflect Racial and Ethnic Disparities in Other Areas of Life
The Stress in America™ survey finds year after year that money and work are the sources of stress that adults most commonly rate as significant. While overall unemployment rates have been falling since the Great Recession, some groups are faring better than others, particularly White adults.12,13 With lower unemployment rates and reported higher wealth, White adults are significantly less likely than Hispanic and Black adults to say that money is a very or somewhat significant source of stress.14
There is a growing financial divide among races and ethnicities. According to DEMOS and Brandeis University’s Institute for Assets & Social Policy, a median White household has about 13 times as much wealth as a median Hispanic household and almost 16 times as much wealth as a median Black household. While 78 percent of Black adults, 77 percent of Hispanics and 70 percent of Asians and AI/AN say that money is a very or somewhat significant source of stress, significantly fewer Whites (62 percent) report feeling significantly or somewhat stressed by money.
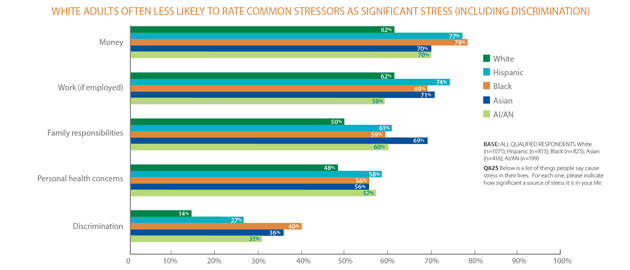
Similar trends can be seen with regard to employment. The unemployment rate according to the Bureau of Labor Statistics for Whites is much lower than for other groups (4.3 percent for Whites, compared to 9.4 for Blacks and 6.4 for Hispanics), with the exception of Asians (3.9 percent).15 The Stress in America™ survey found that employed White adults are slightly less likely than others, with the exception of AI/AN, to say that work is a very or somewhat significant stressor in their lives (62 percent of Whites say this, compared to 74 percent of Hispanics, 71 percent of Asians, 69 percent of Blacks and 59 percent of AI/AN). Whites also are significantly less likely to rate job stability as a significant source of stress (30 percent of Whites say this, compared to 55 percent of Hispanics, 52 percent of Asians, 50 percent of Blacks and 47 percent of AI/AN).
Family responsibilities vary among population groups as a very or somewhat significant source of stress. Asian adults are the most likely to report stress from family responsibilities (69 percent), followed by 61 percent of Hispanics, 60 percent of AI/AN, 59 percent of Blacks and 50 percent of Whites.
Personal health concerns also seem to cause stress among adults. More than half of Hispanics (58 percent) say personal health concerns are a very or somewhat significant source of stress, along with 57 percent of AI/AN, 56 percent of Blacks and Asians and 48 percent of Whites.
Living in a Stressful Environment
Survey findings show that adults in urban areas have a significantly higher reported stress level on average than those in suburban and rural settings (urban: 5.6 on a 10-point scale, vs. 5.0 for suburban and 4.7 for rural).
- White (43 percent) and Asian (55 percent) adults most commonly live in suburban environments, whereas Hispanic (51 percent) and Black (49 percent) adults most commonly report living in urban areas. AI/AN adults are the most likely to report living in small towns or rural areas (41 percent).
- Forty-six percent of adults living in urban areas rate crime and violence as big problems or somewhat of a problem, compared to 19 percent of rural adults and 17 percent of suburban adults saying the same. Similarly, 34 percent of adults in urban areas consider not enough access to healthy foods as a big problem or somewhat of a problem, compared to 20 percent of adults living in rural areas and 13 percent of those in suburban areas saying the same.
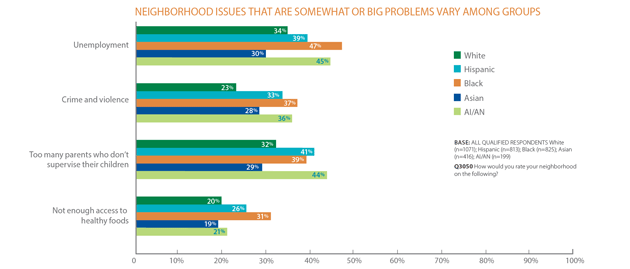
- In addition, adults living in suburban neighborhoods are less likely to rate unemployment as a big or somewhat big problem (22 percent compared to 48 percent of urban and 43 percent of rural neighborhoods saying the same).
- Stress disparities appear across racial groups within the same settings. In urban environments, the average stress level is highest for Hispanics (6.0, compared to 5.5 for Whites, 5.2 for Blacks and 5.1 for Asians).
- Regardless of setting, however, some groups are more likely to rate other neighborhood issues as a big problem or somewhat of a problem, including unemployment, not enough access to healthy foods and poorly maintained community/recreational parks and facilities. In particular, Blacks, AI/AN and Hispanics are more likely (47 percent, 45 percent and 39 percent, respectively) to say unemployment is a big problem or somewhat of a problem, compared to 34 percent of Whites and 30 percent of Asians indicating the same.
- Blacks and Hispanics are more likely (31 percent and 26 percent , respectively ) to say not having enough access to healthy foods is a big or somewhat big problem (compared to 21 percent of AI/AN, 20 percent of Whites and 19 percent of Asians saying the same). Similarly, Blacks and Hispanics are more likely ( 27 percent and 25 percent, respectively) to report poorly maintained community/recreational parks and facilities as a big or somewhat big problem (compared to 20 percent of Asians, 19 percent of AI/AN and 17 percent of Whites saying the same).
- In general, the percentage of non-White groups in poverty is higher than that of Whites, with the exception of Asians. More than four in 10 AI/AN (45 percent), Hispanics (42 percent) and Blacks (41 percent) report being in poverty, as compared to 24 percent of Whites and Asians. Please refer to the Methodology section for this report’s definition of “poverty.” When looking at these groups in total, AI/AN, Hispanics and Blacks also have the highest reported average stress levels (5.4, 5.9 and 5.2, respectively).
Footnotes
1 Anderson, K. F. (2013). Diagnosing discrimination: Stress from perceived racism and the mental and physical health effects. Sociological Inquiry, (83), 55–81. doi: 10.1111/j.1475-682X.2012.00433.x
2 Sirin, S. R., Rogers-Sirin, L., Cressen, J., Gupta, T., Ahmed, S. F., & Novoa, A. D. (2015). Discrimination-related stress effects on the development of internalizing symptoms among Latino adolescents. Child Development. doi: 10.1111/cdev.12343
3 APA’s reference to races and ethnicities are in accordance with the approach taken by the U.S. Census Bureau, which treats race and ethnicity as two separate and distinct categories, examined in two separate questions. This approach is further explained in the Methodology section. The concept of race reflects self-identification by people according to the race or races with which they most closely identify and that people who report themselves as Hispanic can be of any race. This survey comprises responses from adults living in America, regardless of residency or citizenship status.
4 Please refer to the Methodology section for this report’s definition of “disability.”
5 Per the Methodology section, LGBT was defined as those who indicated they were transgender or other, OR consider themselves to be lesbian, gay, bisexual or other. Non-LGBT was defined as those who identify as male or female exclusively, and heterosexual.
6 Per the Methodology section, millennials are defined as people 18 to 36 years old; Gen Xers are defined as people 37 to 50 years old; Baby Boomers are defined as people 51 to 69 years old; and Matures are defined as people age 70 or older.
7 Sawyer, P. J., Major, B., Casad, B. J., Townsend, S. S. M., & Mendes, W. B. (2012). Discrimination and the stress response: Psychological and physiological consequences of anticipating prejudice in interethnic interactions. American Journal of Public Health, 102(5), 1020–1026. Retrieved from https://ajph.aphapublications.org/doi/pdf/10.2105/AJPH.2011.300620opens in new window
8 Generation: Millennials (18 to 36 years old): n=1190; Gen Xers (37 to 50 years old): n=649; Baby boomers (51 to 69 years old): n=1130; Matures (age 70 or older): n=392.
9 Xu, J. Q., Kochanek, K. D., Murphy, S. L., & Arias, E. (2014). Mortality in the United States, 2012. (NCHS Data Brief No. 168). Hyattsville, MD: National Center for Health Statistics. Retrieved from https://blogs.cdc.gov/nchs/2014/10/08/2455/opens in new window
10 Djuric, Z., Bird, C., Furumoto-Dawson, A., Rauscher, G., Ruffin, M., Stowe, R. … Masi, C. (2008). Biomarkers of psychological stress in health disparities research. Open Biomark Journal, (January 1), 7–19.
11 Schneiderman, N., Ironson, G., & Siegel, S. D. (2005). Stress and Health: Psychological, behavioral, and biological determinants. Annual Review of Clinical Psychology, 1, 607–628. Retrieved from https://doi.org/10.1146/annurev.clinpsy.1.102803.144141opens in new window
12 United States Department of Labor. (2016). Labor force statistics from the Current Population Survey: Unemployment rate. Bureau of Labor Statistics. Retrieved from https://data.bls.gov/timeseries/LNS14000000opens in new window
13 United States Department of Labor. (2016). Labor force statistics from the Current Population Survey: E-16. Unemployment rates by age, sex, race, and Hispanic or Latino ethnicity. Retrieved from https://www.bls.gov/web/empsit/cpsee_e16.htmopens in new window
14 Sullivan, L., Meschede, T., Dietrich, L., Shapiro, T., Traub, A., Ruetschlin, C., & Draut, T. (2015). The racial wealth gap: Why policy matters. Demos and Institute on Assets and Social Policy. Retrieved from https://www.demos.org/sites/default/files/publications/RacialWealthGap_2.pdfopens in new window
15 Bureau of Labor Statistics. The Employment Situation – November 2015 https://www.bls.gov/news.release/pdf/empsit.pdfopens in new window
Date created: 2015