

Executive Summary
This report describes the characteristics of online job advertisements for licensed psychologists in the United States to better understand the demand for psychologists in the nation. The data used in this report were obtained from Burning Glass Technologies, a leading developer of online labor market data. Major findings include:
In 2014, there was a total of 12,362 online job ads seeking licensed psychologists. Approximately 1,030 new job ads for licensed psychologists were advertised online each month. For every 100,000 population, there were 3.9 online job ads for licensed psychologists.
Most of the online job ads were located in the most populous states and cities near the coasts. However, when looking at the concentration of online job ads, the highest number of online job ads relative to population were found in states and cities located in central areas of the nation.
The majority of online job ads for licensed psychologists were in the "Health Care and Social Assistance" industry, followed by those in "Public Administration" and "Educational Services." The Department of Veterans Affairs posted the most online job ads seeking licensed psychologists in 2014.
The top skills in demand for licensed psychologists were research, communication, writing, organizational skills, and supervisory skills.
Introduction
This report provides an overview of the online job advertisements for licensed psychologists in the United States in 2014. It describes the types of positions, geographic distribution, employers, and qualifications specified in the online job ads for licensed psychologists. Through the analysis of online job ads, the report provides key information on the demand for licensed psychologists in the nation.1
The data in this report were obtained from Burning Glass Technologies (BGT). BGT compiles online job ads from more than 40,000 web sources and maintains an interactive database of online job ads. In each online job ad, BGT parses up to 70 different data elements including job title, location, employer name and industry, as well as education, experience, and skill qualifications.
The online job ads for licensed psychologists used in this report included those seeking psychologists, clinical psychologists, counseling psychologists, school psychologists, neuropsychologists, clinical neuropsychologists, and industrial-organizational psychologists in the year 2014. Only job ads with keywords "license," "licensed," "licensure," or "license-eligible" were included in this report.2
Overview
In 2014, BGT identified 12,362 online job advertisements for licensed psychologists in the United States. Approximately 1,030 new job ads for licensed psychologists were advertised online each month. For every 100,000 population, there were 3.9 online job ads for licensed psychologists. For every 100,000 online job ads, there were 65.4 seeking licensed psychologists. The major position titles that appear in the job ads seeking licensed psychologists are presented in Table 1opens in new window (PDF, 87KB).
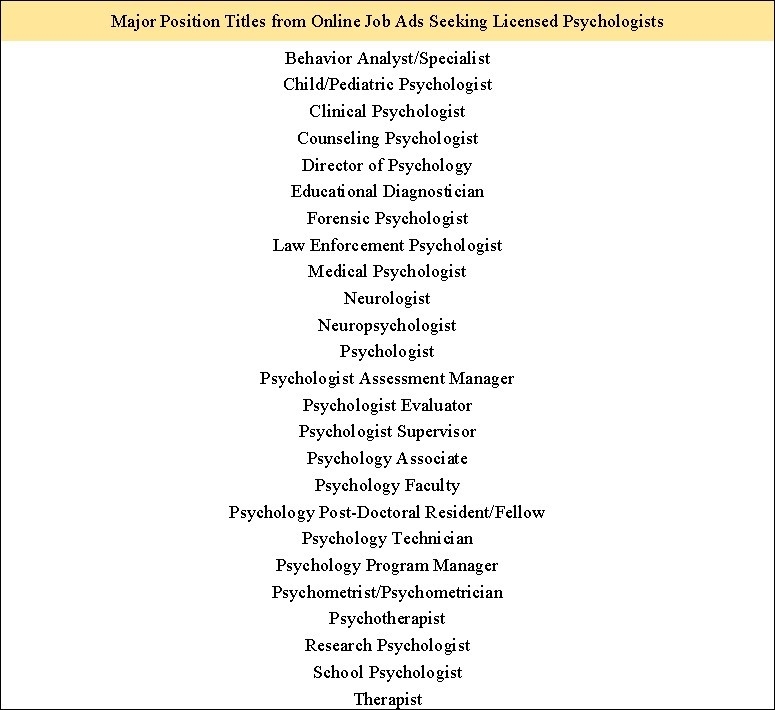
Table 1. Major Position Titles from Online Job Advertisements Seeking Licensed Psychologists, 2014
Source: Labor Insight by Burning Glass Technologies.
Note: Position titles are listed in alphabetical order. This list only includes the major position titles that appear in online job ads for licensed psychologists; position titles with very small numbers of job ads were not included. Accurate numbers of job ads for each title were not available.
Of the job ads that specified type of position, most were permanent positions and only a small portion (11.8 percent) were temporary positions. Approximately 20.1 percent of the online job ads did not specify the type of position.3 Most of the permanent positions were classified as full-time positions and less than ten percent of the permanent positions were classified as part-time positions. See Figure 1opens in new window (PDF, 101KB) for illustration.
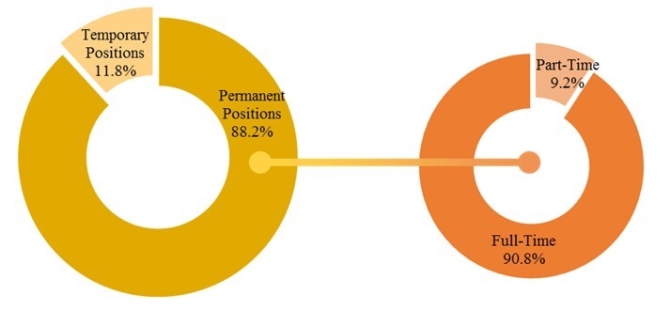
Figure 1. The Types of Positions in Online Job Advertisements for Licensed Psychologists, 2014
Source: Labor Insight by Burning Glass Technologies.
Note: The pie chart on the left represents the percentages of online job ads for licensed psychologists that were specified as either permanent or temporary positions. Job ads that did not specify type of position (20.1 percent of all online job ads for licensed psychologists) were excluded. The pie chart on the right illustrates the employment status (full-time or part-time) of permanent positions for licensed psychologists as specified in the online job ads.
Of the job ads with specified sources, 33.8 percent were from "employer sites," 49.6 percent were from "job boards," and 16.5 percent were from "staffing agencies."4 Approximately 2.8 percent of the online job ads had unspecified sources.
Figure 2opens in new window (PDF, 84KB) is a comparison between the number of online job ads for licensed psychologists and the numbers of online job ads for other occupations in 2014. Compared to most other healthcare occupations or social service occupations ("Physicians, Non-Psychiatrists" at 47,344; "Social Workers" at 35,095; and "Mental Health Counselors" at 17,044), the number of job ads for licensed psychologists was considerably lower. In contrast, the number of online job ads for licensed psychologists was substantially higher than those for other social science occupations. Job ads for "Political Scientists" (3,070), "Economists" (2,349), "Survey Researchers" (1,576), and "Sociologists" (1,370) were all less than a quarter of those for licensed psychologists.5 Such differences in number of job ads may reflect different sizes of workforce across occupations.
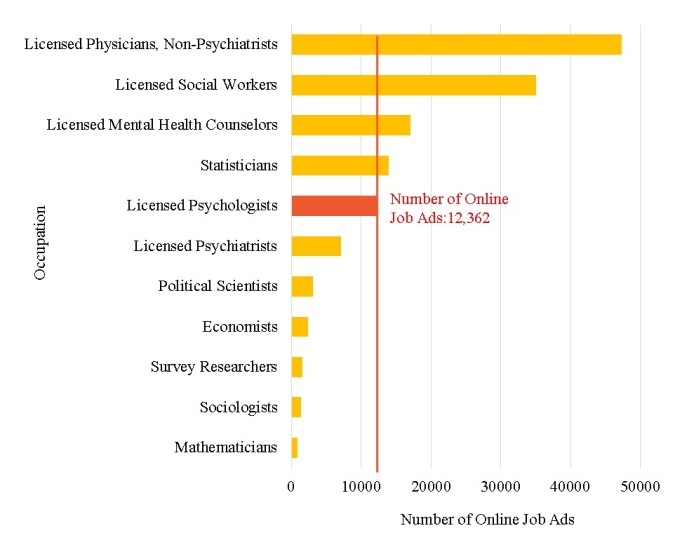
Figure 2 . The Numbers of Online Job Advertisements for Licensed Psychologists and Other Occupations, 2014|
Source: Labor Insight by Burning Glass Technologies.
Geographic Distribution
Figure 3opens in new window (PDF, 112KB) illustrates the distribution of online job ads for licensed psychologists by state and city. The states and cities with larger numbers of job ads for licensed psychologists in 2014 tended to be highly populated and were located in coastal areas. The states with the highest numbers of job ads for licensed psychologists were California (1,683), Texas (690), New York (647), Illinois (624), and North Carolina (611). The cities with the highest numbers of job ads for licensed psychologists were New York City (572), Chicago (481), San Francisco (380), Seattle (333), and Los Angeles (290).
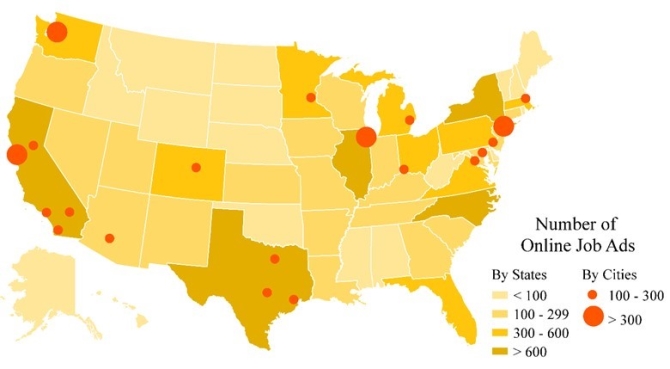
Figure 3. Distribution of Online Job Advertisements for Licensed Psychologists, 2014
Source: Labor Insight by Burning Glass Technologies; Topologically Integrated Geographic Encoding and Referencing (TIGER) State Map and MSA Map from U.S. Census Bureau.
When controlling for population, the states and cities with the highest concentration of job ads for licensed psychologists were less populous and tended to be located in the central areas of the nation. As Figure 4opens in new window (PDF, 111KB) illustrates, the states with the highest numbers of online job ads for licensed psychologists per 100,000 population were Alaska (12.8), District of Columbia (9.7), South Dakota (8.4), North Dakota (7.8), and Colorado (7.4). The cities with the highest numbers of online job ads for licensed psychologists per 100,000 population were Fairbanks, AK (49.3); Manhattan, KS (37.7); Mankato, MN (29.4); St. Cloud, MN (28.1); and Iowa City, IA (26.2).
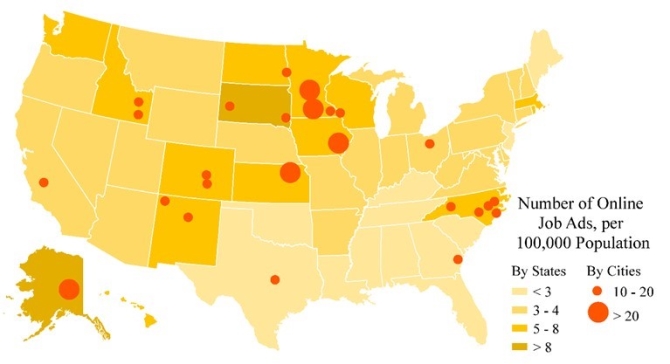
Figure 4 . Distribution of Online Job Advertisements for Licensed Psychologists, per 100,000 Population, 2014
Source: Labor Insight by Burning Glass Technologies; 2014 Population Estimates from U.S. Census Bureau; Topologically Integrated Geographic Encoding and Referencing (TIGER) State Map and MSA Map from U.S. Census Bureau.
The location quotient (LQ)6 is another commonly used metric that can be used to analyze the geographic distribution of online job ads for licensed psychologists. LQ is a measure of the concentration of online job ads for licensed psychologists in a location relative to its employed population in relation to the national average. A higher LQ implies that licensed psychologists in a given location have better prospects of finding a job online compared to other locations in the country. For example, Chicago had an LQ of 1.2 in 2014, which indicates that the concentration of online job ads for licensed psychologists in Chicago was 20 percent higher than the national average. Conversely, Houston had an LQ of 0.4 in 2014, which indicates that the concentration of online job ads for licensed psychologists in Houston was 60 percent lower than the national average.
Table 2opens in new window (PDF, 86KB) lists the states and cities with the highest and lowest LQs in 2014. The LQ results are similar to the results from the number of job ads per 100,000 population. This overlap suggests that the locations with more job ads for licensed psychologists in relation to population had highly favorable job markets for licensed psychologists. In particular, the concentrations of job ads for licensed psychologists in Alaska and New Mexico were both at least twice the level of the national average. In contrast, cities in Florida including Orlando, Tampa, and Miami had the lowest concentrations of job ads and were among those cities with the least favorable job markets for licensed psychologists.
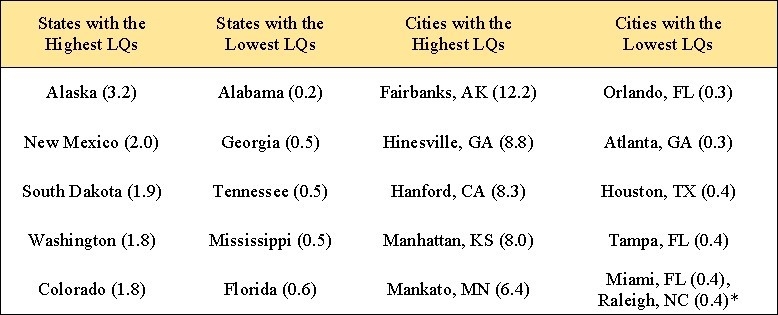
Table 2 . States and Cities with the Highest and Lowest Location Quotients, 2014
Source: Labor Insight by Burning Glass Technologies.
Note: LQ values are in parentheses. States and cities with numbers of online job ads for licensed psychologists less than 20 were excluded from this table.
*Raleigh, NC had the same estimated LQ as Miami, FL.
Employers
In 2014, the employers who posted the highest numbers of online job ads seeking licensed psychologists were the Department of Veterans Affairs (860), Kaiser Permanente (278), the U.S. Army Medical Corps (185), MedOptions (153) and Corizon (121).7 Approximately 25.3 percent of the online job ads did not specify employer information.
Industries
Of the online job ads with specified industry sector information, about half were in the "Health Care and Social Assistance" industry, 22.9 percent were in "Public Administration," 18.9 percent were in "Educational Services," and 9.4 percent were in other industry sectors.8
Approximately 15.7 percent of the online job ads for licensed psychologists did not specify industry information. See Figure 5opens in new window (PDF, 145KB) for a complete breakdown of the most common industries of the online job ads for licensed psychologists.
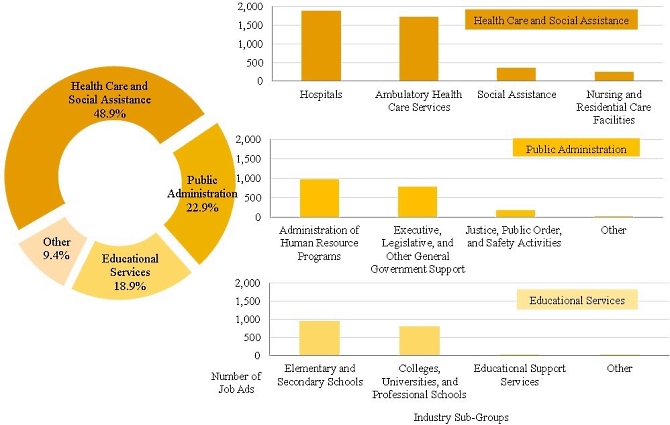
Figure 5 . Industry Composition of Online Job Advertisements for Licensed Psychologists, 2014
Source: Labor Insight by Burning Glass Technologies.
Note: Online job ads without specified industry information (15.7 percent of the job ads) were excluded from this graph. Totals may not sum to 100 percent due to rounding.
Qualifications
The majority of the online job ads for licensed psychologists in 2014 specified certain education, skill, or experience qualifications.9
Of the online job ads that specified an education qualification, 97.8 percent required a graduate or a professional degree. Of all the online job ads for licensed psychologists, 30.4 percent did not specify an education qualification.
Of the online job ads that provided experience qualification information, 61.6 percent specified more than 2 years of professional experience, 11.8 percent specified more than 5 years of experience, and 1.9 percent specified more than 8 years of experience. Approximately 55.9 percent of the online job ads for licensed psychologists did not specify experience qualifications. See Figure 6opens in new window (PDF, 83KB) for illustration.
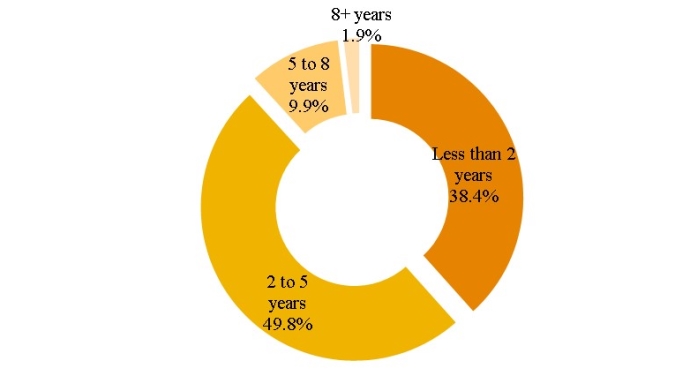
Figure 6. Experience Qualifications Specified in Online Job Advertisements for Licensed Psychologists, 2014
Source: Labor Insight by Burning Glass Technologies.
Note: Approximately 55.9 percent of the online job ads for licensed psychologists did not specify experience qualification information and were not included in this figure.
Figure 7opens in new window (PDF, 141KB) provides a list of the top skills in demand as specified in the online job ads for licensed psychologists in 2014. The top skills in demand (i.e., the most frequently cited skill qualifications in the online job ads) for licensed psychologists were research, communication, writing, organizational skills, and supervisory skills. Microsoft Excel, Microsoft PowerPoint, Microsoft Word, C++, and SPSS were the top software skills in demand for licensed psychologists. Approximately 30.2 percent of the online job ads did not specify skill qualifications.
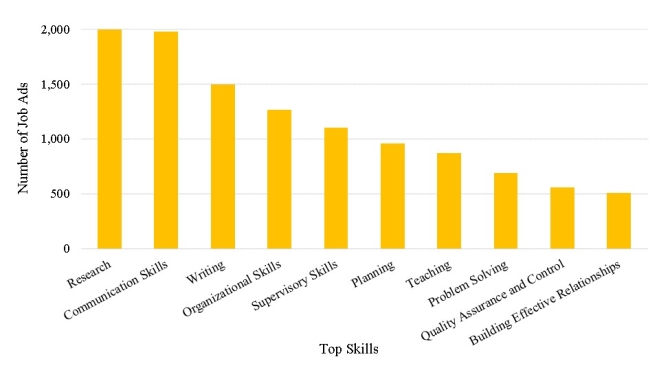
Figure 7. Top 10 Skills in Online Job Advertisements for Licensed Psychologists, 2014
Source: Labor Insight by Burning Glass Technologies.
Note: Approximately 30.2 percent of the online job ads did not specify skill qualifications.
Conclusion
In 2014, there were 12,362 job advertisements for licensed psychologists in the United States according to BGT. Most of the online job ads were located near the coasts. When comparing the number of online job ads relative to the population, the top cities were located in central areas of the nation. Of the online job ads with industry sector data available, about half were in the "Health Care and Social Assistance" industry. Among the top demanded skills for licensed psychologists were research, communication, writing, organizational skills, and supervisory skills.
BGT provides an innovative, timely, and useful data source to help understand labor demand. Nonetheless, online job ads data only provide one piece of the puzzle. Future research can benefit from the use of online job ads data in conjunction with traditional labor market data to present a more comprehensive snapshot of the demand of the psychology workforce.
For example, the characteristics of mental illness in a population are expected to affect the need for psychological services and are therefore related to the demand for psychologists. Future research will be needed to examine this relationship through the use of online job ads data as well as data on population mental illness. In addition, analyses on both the "unmet demand" (i.e., online job ads for psychologists) and the "excess supply" (i.e., unemployed psychologists) may have policy implications to promote a labor market equilibrium. Furthermore, unmet labor demand affects wage levels; therefore, future studies on the salaries in the field may also use online job ads as one of the proxies for determining psychologists’ salary levels.
APA’s Center for Workforce Studies will further explore the potential of online job ads data to analyze the psychology workforce.
Notes
1 The Bureau of Labor Statistics (BLS) uses job openings as a demand-side indicator of labor shortages (i.e., the unmet demand for labor). BLS defines a “job opening” as a specific position such that employers are actively recruiting via advertisements to fill that available position. With this statistic, it is possible to paint a more complete picture of the labor market. (Job Openings and Labor Turnover Survey, 2002).
2 Occupation titles were based on O*NET codes/classifications. Due to technical limitations, job ads that did not require licensure but “preferred” licensed psychologists were included; job ads for psychologists that required licenses other than a psychologist license were also included (e.g., social work license). See technical documentation and discussions on limitations in the Appendixopens in new window (PDF, 589KB)
3 Data elements (e.g., industry, employer, employment status, etc.) in the online job ads are considered “unspecified” when: 1) a job posting did not advertise for a particular job characteristic or 2) BGT’s algorithms were unable to classify and code a particular job characteristic for that job posting. See Limitations of BGT Data for more information regarding unspecified data elements in the online job ads.
4 “Employer sites” are websites where specific employers post their job openings; “job boards” are paid-for websites where job ads are posted for multiple employers, locations, and job types; “staffing agencies” are staffing firms or intermediary recruiting agencies. See Technical Documentation for details.
5 See Technical Documentation on the methods used to retrieve the numbers of job ads for different occupations.
6 The LQ metric is commonly used by economists, as well as federal agencies such as the Bureau of Labor Statistics as a way to identify and support unique industries in a given region and to determine an area’s distribution of employment. See Technical Documentation for the location quotient formula.
7 The U.S. Department of Veterans Affairs provides patient care and federal benefits to veterans and their family members. Kaiser Permanente is an integrated managed care association that combines a nonprofit insurance plan with its own hospitals and clinics. The U.S. Army Medical Corps is a non-combat specialty branch of the U.S. Army Medical Department comprised of commissioned medical officers that represent all specialties of civilian medicine. MedOptions provides behavioral health services to nursing and assisted living facilities and hires multidisciplinary teams of psychiatrists, psychologists, etc. to improve elderly mental health services. Corizon provides mental healthcare services in U. S. correctional facilities.
8 BGT categorizes employers into different industry sectors based on the North American Industry Classification System (NAICS). Other industry sectors include “Finance and Insurance,” “Professional, Scientific, and Technical Services,” “Manufacturing,” etc. See detailed categorization in Technical Documentation.
9 Qualifications refer to the education level, experience, and skills that were specified in the job ads as desired or required for the candidate to qualify for the advertised position. Definition and taxonomy of education, experience and skill qualifications were from BGT. See Technical Documentation for details.
Burning Glass Technologies. (2015). Labor Insight [Online analytic application]. Retrieved from https://laborinsight.burning-glass.com/jobs/us#/opens in new window
Burning Glass Technologies. (2015). Labor Insight [Presentation slides].
U.S. Bureau of Labor Statistics. Job Openings and Labor Turnover Survey (JOLTS), July 2013. Retrieved from https://www.bls.gov/jlt/jltwhat.htmopens in new window
U.S. Census Bureau. (2013). Principle cities of metropolitan and micropolitan statistical areas. Retrieved from https://www.census.gov/population/metro/data/def.htmlopens in new window
U. S. Census Bureau. (2014). Annual estimates of the resident population: April 1, 2010 to July 1, 2014. Retrieved from https://www.census.gov/popest/data/metro/totals/2014/CBSA-EST2014-alldata.htmlopens in new window
U. S. Census Bureau. (2014). Annual estimates of the resident population: April 1, 2010 to July 1, 2014. Retrieved from https://www.census.gov/popest/data/state/totals/2014/index.htmlopens in new window
U.S. Census Bureau. (2014). Topologically integrated geographic encoding and referencing metropolitan statistical area/micropolitan statistical area shape file. Retrieved from ftp://ftp2.census.gov/geo/tiger/TIGER2014/CBSA/opens in new window
U.S. Census Bureau. (2014). Topologically integrated geographic encoding and referencing state and equivalent shape file. Retrieved from ftp://ftp2.census.gov/geo/tiger/TIGER2014/STATE/opens in new window
- Appendix: Methodologies, Limitations of Data, and Technical Documentationopens in new window (PDF, 589KB)
- Figure 1: The Types of Positions in Online Job Advertisements for Licensed Psychologists, 2014opens in new window (PDF, 101KB)
- Figure 2. The Numbers of Online Job Advertisements for Licensed Psychologists and Other Occupations, 2014opens in new window (PDF, 84KB)
- Figure 3. Distribution of Online Job Advertisements for Licensed Psychologists, 2014opens in new window (PDF, 112KB)
- Figure 4. Distribution of Online Job Advertisements for Licensed Psychologists, per 100,000 Population, 2014opens in new window (PDF, 111KB)
- Figure 5. Industry Composition of Online Job Advertisements for Licensed Psychologists, 2014opens in new window (PDF, 145KB)
- Figure 6. Experience Qualifications Specified in Online Job Advertisements for Licensed Psychologists, 2014 opens in new window(PDF, 83KB)
- Figure 7. Top 10 Skills in Online Job Advertisements for Licensed Psychologists, 2014opens in new window (PDF, 141KB)
Recommended citation: American Psychological Association (2016). 2014 Online Job Advertisements for Licensed Psychologists. Washington, DC: Author.
This report describes research and analysis conducted by staff members of the American Psychological Association’s Center for Workforce Studies. It does not constitute official policy of the American Psychological Association.
The authors thank Howard Kurtzman and Jaime Diaz-Granados for valuable input on previous drafts of this report.