

Executive Summary
Each year, the U.S. Department of Education’s Integrated Postsecondary Education Data System (IPEDS) gathers information from every postsecondary institution that participates in federal student aid programs. Although IPEDS data collection consists of a series of 12 interrelated survey components that cover nine major areas, this report focuses specifically on two IPEDS surveys: 1) Completions and 2) Institutional Characteristics. Based on these surveys, a profile of psychology doctoral and master’s degrees awarded over a ten-year span (2004-2013) was created. Major findings include:
The number of psychology doctorates and master’s degrees awarded increased over the decade. Between 2004 and 2013, the number of psychology doctorates awarded by U.S. institutions grew by 31.7 percent, from 4,933 in 2004 to 6,496 in 2013. The number of psychology master’s degrees awarded increased by 54.2 percent, from 18,457 in 2004 to 28,462 in 2013.
In 2013, more than half (55.7 percent) of psychology doctorates were awarded in the “health service provider” (HSP) broad field. The remaining 44.3 percent of psychology doctorates were awarded in the “research” broad field. A similar pattern was found for master’s degrees. In 2013, the percentage of master’s degrees awarded in psychology was 57.7 percent in HSP subfields and 42.3 percent in research subfields.
Between 2004 and 2013, the greatest number of psychology doctorates awarded was in clinical psychology. In 2013, 2,550 doctoral degrees were awarded in clinical psychology. The largest rate of growth (102.1 percent) over the ten years was for doctorates awarded in experimental psychology.
Between 2004 and 2013, the greatest number of master’s degrees awarded in psychology was in counseling psychology. In 2013, 9,663 master’s degrees were awarded in counseling psychology. The greatest rate of growth for psychology master’s degrees awarded was in forensic psychology, which grew by 448.8 percent over the ten-year span.
Private not-for-profit institutions awarded the most psychology doctorates in 2013, representing 45.5 percent of all psychology doctorates awarded that year. Private for-profit institutions awarded the fewest doctorates, but their rate of growth in psychology doctorates awarded over 2004-2013 (122.9 percent) was greater than for other institution types.
Private-not-for-profit institutions awarded the highest number of psychology master’s degrees, representing 53.6 percent of all psychology master’s degrees awarded in 2013. Private for-profit institutions awarded the fewest master’s degrees in psychology. However, these institutions had the greatest rate of growth over ten years, increasing by 317.3 percent between 2004 and 2013.
In 2013, academic institutions in the states of California, Illinois and New York awarded the largest numbers of psychology doctorates. The largest number of master’s degrees were awarded in the states of California, Arizona and Texas. Between 2004 and 2013, the greatest percent growth in psychology doctorates awarded was for institutions within the states of Iowa, Washington, and Arizona. Similarly, the greatest ten-year growth in psychology master’s degrees awarded was found for institutions in the states of Arizona, Iowa, and North Dakota.
Introduction
The purpose of this report is to provide an overview of the number of postgraduate degrees awarded in psychology each year. Specifically, this report focuses on psychology doctorate and master’s degrees awarded over a ten-year span, ranging from academic years 2004 to 2013.1
The IPEDS Completions Survey2 collects data on the number of postsecondary degrees awarded each year. The data can be broken down further by academic field of study, with each field assigned a Classification of Instructional Programs (CIP) code. This report focuses solely on master’s and doctoral degrees awarded in the field of psychology (CIP=42). The Institutional Characteristics Survey3 collects information on academic institutions awarding these degrees, such as geographical location, type of institution and Carnegie Classifications.4 Together, data from these two IPEDS surveys were examined to determine the number of doctoral and master’s degrees awarded in psychology from 2004 to 2013.
A brief overview provides data on the number of psychology doctorates and master’s degrees awarded over a ten-year period (2004-2013). Section 1 of this report examines the numbers of psychology doctorates and master’s degrees awarded during this time frame, broken down into degrees in “health service provider” and “research” broad fields. Section 2 drills down further to the number of doctorates and master’s degrees awarded in specific subfields of psychology, such as clinical psychology, counseling psychology, general psychology, experimental psychology, industrial and organizational psychology, and other subfields. Section 3 presents the number of psychology doctorates and master’s degrees awarded by different types of institution, such as public institutions, private not-for-profit institutions, and private for-profits. Section 4 displays maps that depict the statewide distribution of doctorates and master’s degrees awarded in psychology. Finally, issues for future research are discussed in the Conclusion.
Appendix Aopens in new window (PDF, 424KB) contains technical documentation of IPEDS methodology and of the variable taxonomy used in this report. Data supporting the figures in the report are provided in Appendix Bopens in new window (PDF, 513KB) .
Limitations of IPEDS Data
Despite the wealth of information collected by IPEDS, there were some limitations in the data. Specifically, IPEDS data cannot distinguish between a psychology terminal master’s degree, and a psychology master’s degree obtained on the way to completing a doctoral degree in psychology. As such, it is impossible to provide an exact count of the number of terminal versus non-terminal psychology master’s degrees awarded each year.
Another limitation is that in 2013, 29.7 percent of all psychology doctorates and 22.3 percent of all psychology master’s degrees fell within the subfield of “Psychology, General.” It is difficult to determine why a quarter of all doctorates and master’s degrees were placed into this subfield, since most graduate-level programs place an emphasis on a specific subfield of psychology, rather than a general program in psychology, which is more common with baccalaureate degrees in psychology. It cannot be determined if psychology doctorates and master’s degrees that fell into this category genuinely belong there, or if administrators who submitted data to IPEDS did not or could not provide the exact subfield of psychology in which their graduates completed degrees.
It is also difficult to determine if the large number of psychology master’s degrees that fell within the subfield of counseling psychology included degrees awarded in counseling. “Counseling” and “counseling psychology” degrees are related, but are awarded by different programs.
Finally, IPEDS does not require institutions to specify the exact types of psychology doctoral degrees awarded – of which there are potentially several – including PhD, PsyD, SciD, DPhil, etc. Instead, they asked institutions to specify whether a psychology doctorate awarded was a “research/scholarship” doctorate (e.g., PhD) or a “professional practice degree” (e.g., PsyD). Many participating institutions did not always identify psychology PhDs as research/scholarship doctorates and PsyDs as professional practice doctorates. There were examples within the IPEDS database of institutions known to award the PsyD degree exclusively, that identified their doctoral degrees in the “research/scholarship” category. Because a one-to-one correspondence could not be made between PsyD and professional practice or between PhD and research/scholarship, it was not possible to provide separate counts of PsyD and PhD doctorates awarded annually in psychology.
Overview
Overall, the number of psychology doctorates and master’s degrees awarded has increased over the last decade (see Figure 1opens in new window (PDF, 260KB)). The number of psychology doctorates awarded in the U.S. grew from 4,933 in 2004 to 6,496 in 2013 – an increase of 1,563 or 31.7 percent. Between 2004 and 2013, the number of master’s degrees awarded in the U.S. grew from 18,457 to 28,462, an increase of 10,005 (54.2 percent).
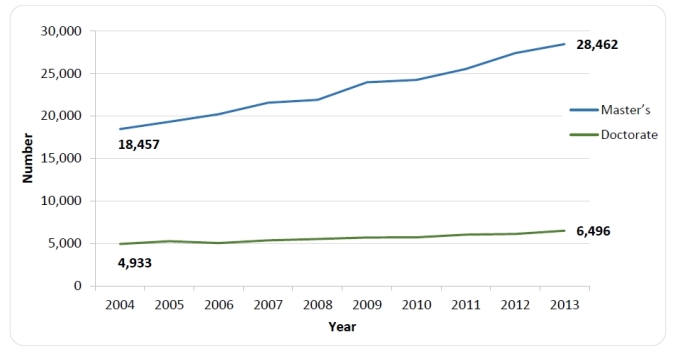
Figure 1. Number of Psychology Doctorate and Master’s Degrees Awarded, 2004-2013
Source: IPEDS Completions Survey (2004-2013)
Section 1: Psychology Degrees Awarded in Health Service Provider and Research Broad Fields
This section presents data for psychology doctorates and master’s degrees awarded between 2004 and 2013, broken down into “health service provider” (HSP) and “research” broad fields. Subfields of psychology that fall under HSP include such areas as clinical, counseling and school psychology.5,6 Subfields that fall under research include such areas as cognitive, developmental and child, social, experimental, and industrial and organizational psychology. Table 1opens in new window (PDF, 344KB) displays a full list of Classification of Instructional Programs (CIP) code names categorized into HSP and research broad fields.
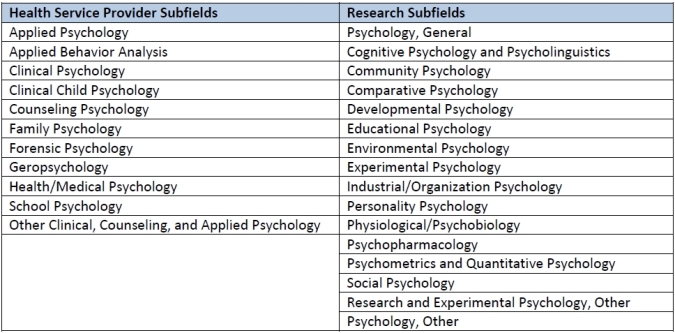
Table 1. Breakdown of Psychology Classification of Instructional Programs (CIP) into Health Service Provider and Research Broad Fields
Source: IPEDS Completions Survey (2004-2013)
Note: For Health Service Provider subfields, geropsychology was added to IPEDS in 2006; applied psychology, applied behavior analysis, and other clinical, counseling, and applied psychology were added in 2010. For research subfields, comparative psychology was added to IPEDS in 2006; research and experimental, other was added in 2010.
Psychology Doctorates Awarded in HSP and Research Broad Fields
In 2013, more than half (55.7 percent) of psychology doctorates were awarded in subfields that fall under the health service provider broad field. The remaining 44.3 percent of psychology doctorates were awarded in subfields that fall into the research broad field. As shown in Figure 2opens in new window (PDF, 264KB), the number of psychology doctoral degrees awarded between 2004 and 2013 grew by 33.7 percent for the HSP broad field (from 2,705 in 2004 to 3,616 in 2013) and 29.3 percent for the research broad field (from 2,228 in 2004 to 2,880 in 2013).
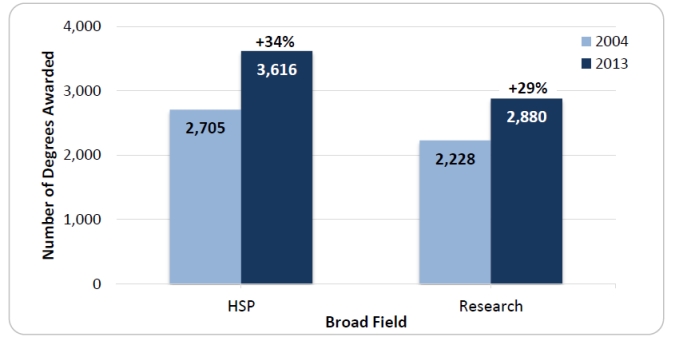
Figure 2. Growth in Number of Psychology Doctorates Awarded in Health Service Provider (HSP) and Research Broad Fields, 2004-2013
Source: IPEDS Completions Survey (2004-2013)
Psychology Master’s Degrees Awarded in HSP and Research Broad Fields
A similar pattern can be found for master’s degrees in psychology. In 2013, the percentage of master’s degrees awarded in psychology were 58 percent in the HSP broad field and 42 percent in the research broad field. The rate of growth over ten years was even greater for HSP master’s degrees than for HSP doctorates. Figure 3opens in new window (PDF, 264KB) shows that between 2004 and 2013, the number of HSP master’s degrees awarded in psychology grew by 70.1 percent, from 9,651 in 2004 to 16,413 in 2013. The number of master’s degrees in the research broad field grew as well, but at a slower rate of 36.8 percent (from 8,806 in 2004 to 12,049 in 2013).
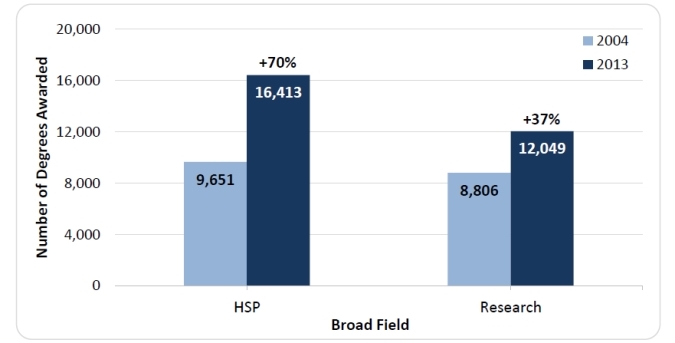
Figure 3. Growth in Number of Psychology Master’s Degrees Awarded in Health Service Provider (HSP) and Research Broad Fields, 2004-2013
Section 2: Psychology Doctorates by Subfield
Psychology Doctorates by Subfield
In this report, we focus on the ten subfields in which the highest numbers of doctorates in psychology were awarded. In 2013, 93 percent of all psychology doctorates were awarded in these ten subfields.7
- Clinical Psychology
- Psychology, General
- Counseling Psychology
- Educational Psychology
- School Psychology
- Industrial and Organizational Psychology
- Experimental Psychology
- Other Clinical, Counseling and Applied Psychology
- Social Psychology
- Developmental and Child Psychology
Of these top ten subfields, the highest percentage of psychology doctorates were awarded in clinical psychology (42.3 percent), followed by psychology, general (29.7 percent).8 Far behind were counseling psychology (8.4 percent), educational psychology (7.6 percent), and school psychology (5.2 percent). Figure 4opens in new window (PDF, 264KB) displays the percentage of psychology doctoral degrees awarded in 2013 by HSP and research subfields.
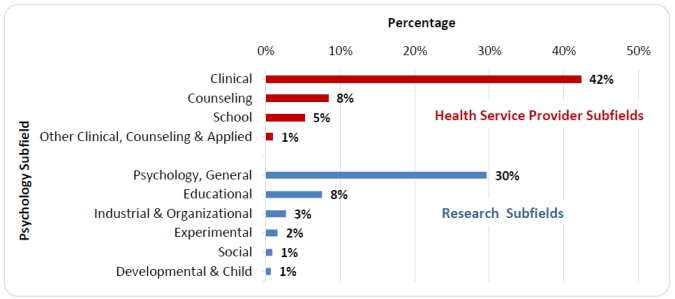
Figure 4. Psychology Doctorates Awarded in Health Service Provider and Research Subfields, 2013.
Source: IPEDS Completions Survey (2013)
Figure 5opens in new window (PDF, 289KB) shows that over a ten-year span, the number of doctorates awarded increased for each psychology subfield. The largest number of psychology doctorates continued to be awarded in the HSP subfield of clinical psychology, with 2,121 awarded in 2004 and increasing to 2,550 by 2013 (a 20.2 percent increase). The second highest number of psychology doctorates continued to be awarded in the research subfield of psychology, general, increasing from 1,437 in 2004, to 1,788 in 2013 (a 24.4 percent increase).

Figure 5. Number of Psychology Doctorates Awarded in Health Service Provider (HSP) and Research Subfields, 2004-2013
Source: IPEDS Completions Survey (2004-2013)
Note: The subfield other clinical, counseling and applied psychology was added to the IPEDS system in 2010.
Although the greatest number of psychology doctorates awarded were in clinical psychology, the largest rate of growth over ten years was in experimental psychology.9 Table 2opens in new window (PDF, 347KB) shows that between 2004 and 2013, the number of doctorates awarded in experimental psychology increased by 102.1 percent. Industrial and organizational psychology degrees increased by 91.8 percent over ten years, followed by school psychology (59.9 percent), counseling psychology (43.5 percent), and educational psychology (32.9 percent).
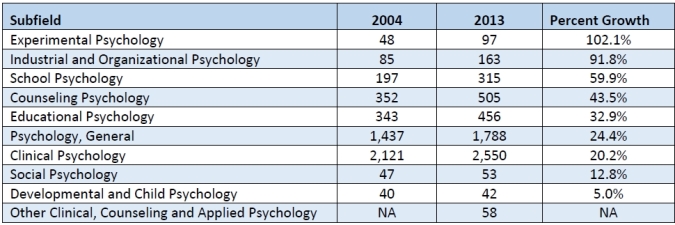
Table 2. Ten-Year Growth in Number of Psychology Doctorates Awarded by Subfield, 2004-2013
Source: IPEDS Completions Survey (2004-2013)
Note: The subfield other clinical, counseling and applied psychology was added to the IPEDS system in 2010.
Psychology Master’s Degrees by Subfield
For master’s degrees, this report focuses on the ten subfields in which the highest number of master’s degrees in psychology were awarded. In 2013, 89 percent of all psychology master’s degrees were awarded in these ten subfields:10
- Counseling Psychology
- Psychology, General
- Clinical Psychology
- School Psychology
- Educational Psychology
- Industrial and Organizational Psychology
- Forensic Psychology
- Applied Psychology
- Other Clinical, Counseling and Applied Psychology
- Community Psychology
Figure 6opens in new window (PDF, 265KB) displays the percentage of 2013 psychology master’s degrees awarded in these top ten subfields, broken down by HSP and research broad fields. The highest number of master’s degrees was awarded in counseling psychology (38.6 percent). 11 Second was psychology, general, in which 25.3 percent of all psychology master’s degrees were awarded. This was followed by clinical psychology (11.5 percent), school psychology (7.0 percent), and educational psychology (5.4 percent).
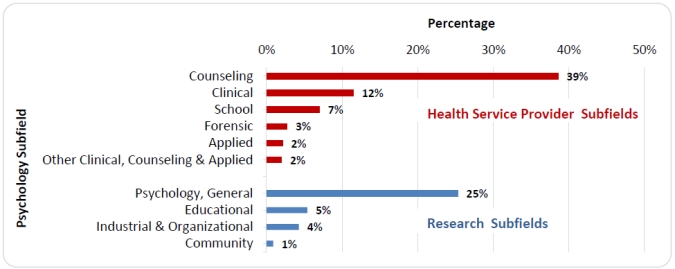
Figure 6. Psychology Master’s Degrees Awarded in Health Service Provider (HSP) and Research Subfields, 2013
Source: IPEDS Completions Survey (2013)
Over a ten-year span, the number of master’s degrees awarded increased in every psychology subfield except for industrial and organizational psychology and community psychology. Figure 7opens in new window (PDF, 292KB) illustrates this trend, with counseling psychology showing the largest number of master’s degrees awarded, growing from 6,305 in 2004 to 9,663 in 2013 (53.3 percent growth). The second highest number of psychology master’s degrees were awarded in psychology, general, increasing from 4,582 in 2004 to 6,344 in 2013 (38.5 percent growth). In contrast, master’s degrees in industrial and organizational psychology declined from 1,342 in 2004 to 1,070 in 2013. A similar pattern was found for master’s degrees awarded in community psychology, declining from 298 in 2004 to 226 in 2013.
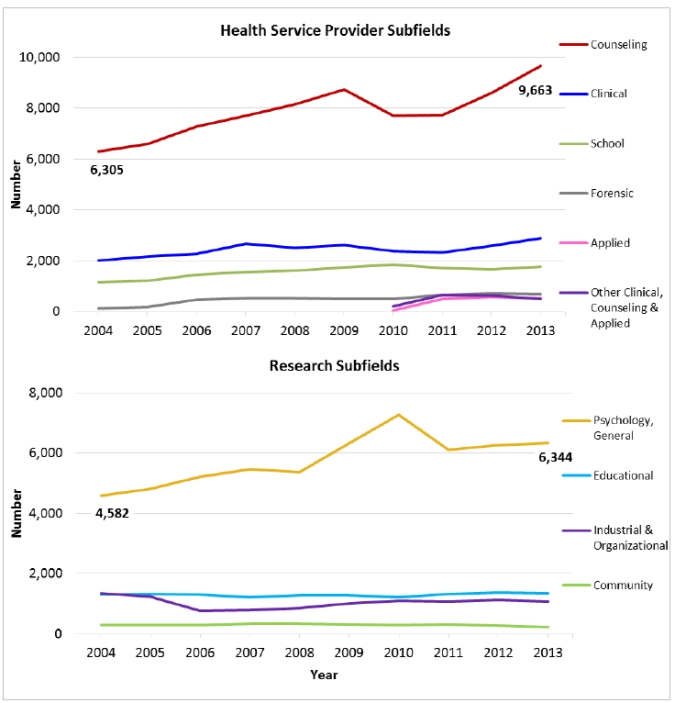
Figure 7. Number of Psychology Master's Degrees Awarded in Health Service Provider and Research Subfields, 2004-2013
Source: IPEDS Completions Survey (2004-2013)
Note: The subfields “applied psychology” and “other clinical, counseling and applied psychology” were added to the IPEDS system in 2010.
For psychology master’s degrees, the greatest rate of growth was in forensic psychology. Table 3opens in new window (PDF, 346KB) illustrates that in 2004, 125 master’s degrees in forensic psychology were awarded. By 2013, the number increased to 686, a growth of 448.8 percent.12 Master’s degrees in counseling psychology grew by 53.3 percent, followed by school psychology (51.8 percent), and clinical psychology (43.0 percent). Likewise, some subfields experienced a 10-year decline in psychology master’s degrees awarded. Specifically, the number of industrial and organizational psychology master’s degrees awarded showed a negative rate of growth of -20.3 percent between 2004 and 2013. Likewise, community psychology’s 10-year rate-of-growth was -24.2 percent.
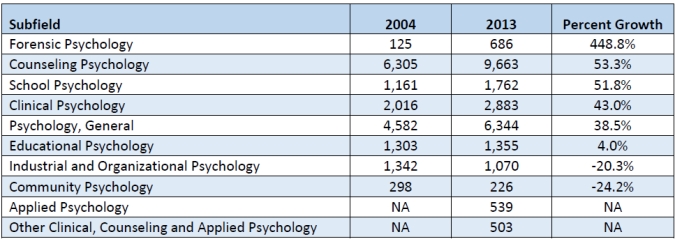
Table 3. Ten-Year Growth in Number of Psychology Master's Degrees Awarded by Subfield, 2004-2013
Source: IPEDS Completions Survey (2004-2013) Note: “Applied Psychology” and “other Clinical, Counseling and Applied Psychology” were not included in IPEDS until 2010. Master’s degrees awarded in community psychology rose 14 percent between 2004 and 2007, but then experienced a decline of 34 percent between 2008 and 2013.
Section 3: Psychology Degrees Awarded by Institution Type
This section presents data for psychology doctorates and master’s degrees awarded between 2004 and 2013, broken down by the type of institution that awarded these degrees: (1) public institutions, (2) private not-for profit institutions, and (3) private for-profit institutions.13
Psychology Doctorates Awarded by Institution Type
Figure 8opens in new window (PDF, 262KB) illustrates that private not-for-profit institutions awarded the most psychology doctorates in 2013 (2,953), representing 45.5 percent of all doctorates awarded that year. This was an increase of 24.4 percent since 2004. Public institutions awarded the second highest number of doctorates in 2013 (2,529), representing 38.9 percent of all doctorates awarded – an increase of 20.4 percent since 2004. Finally, private for-profit institutions awarded the fewest doctorates (15.6 percent), but their rate of growth was greater than other institution types. The number of psychology doctorates awarded by these institutions grew from 455 to 1,104, a 122.9 percent increase between 2004 and 2013.
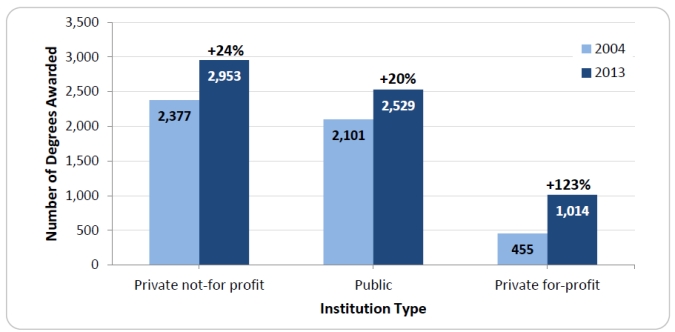
Figure 8. Growth in Number of Psychology Doctorates Awarded by Institution Type, 2004-2013
Source: IPEDS Completions Survey (2004-2013) and IPEDS Institutional Characteristics Survey (2004-2013)
Psychology Master’s Degrees Awarded by Institution Type
As shown in Figure 9opens in new window (PDF, 337KB), private not-for-profit institutions awarded the highest number of master’s degrees (15,254), representing 53.6 percent of all psychology master’s degrees awarded in 2013 – an increase of 51.1 percent since 2004. Public institutions awarded the second highest number of master’s degrees in 2013 (8,922), representing 31.3 percent of master’s degrees awarded that year. This was an increase of 21.7 percent between 2004 and 2013. Private for-profit institutions awarded the fewest master’s degrees in psychology (15.1 percent). However, these institutions had the greatest rate of growth over ten years, increasing by 317.3 percent, with 1,027 master’s degrees awarded in 2004 growing to 4,286 awarded in 2013.
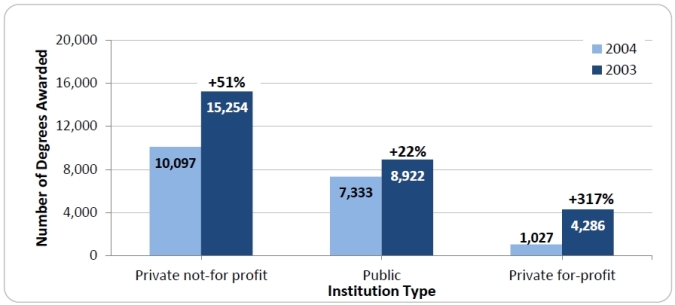
Figure 9. Growth in Number of Psychology Master's Degrees Awarded by Institution Type, 2004-2013
Source: IPEDS Completions Survey (2004-2013) and IPEDS Institutional Characteristics Survey (2004-2013)
Section 4: Psychology Degrees Awarded by State
The following section describes the number of psychology doctorates and master’s degrees awarded between 2004 and 2013, broken down at the state level.
Psychology Doctorates Awarded by State
Figure 10opens in new window (PDF, 426KB) displays two maps, which depict the number of psychology doctorates awarded in 2013 for each state, as well as the percent growth in psychology doctorates awarded in each state between 2004 and 2013. In 2013, 18.7 percent of all psychology doctorates (2,293) were awarded by institutions in California, followed by 8.2 percent awarded in Illinois (535 psychology doctorates) and 7.7 percent in New York (500 psychology doctorates). The smallest percentage of psychology doctorates were awarded by institutions within the states of Montana (0.08 percent), Alaska (0.05 percent), and Delaware (0.05 percent).
Between 2004 and 2013, the greatest percent growth in the number of psychology doctorates was in the state of Iowa (183 percent), followed by Washington state (176 percent) and Arizona (148 percent). States that showed the largest percent decline in psychology doctorates over the ten years were Montana (-38 percent), Connecticut (-33 percent), and New Mexico (-26 percent).
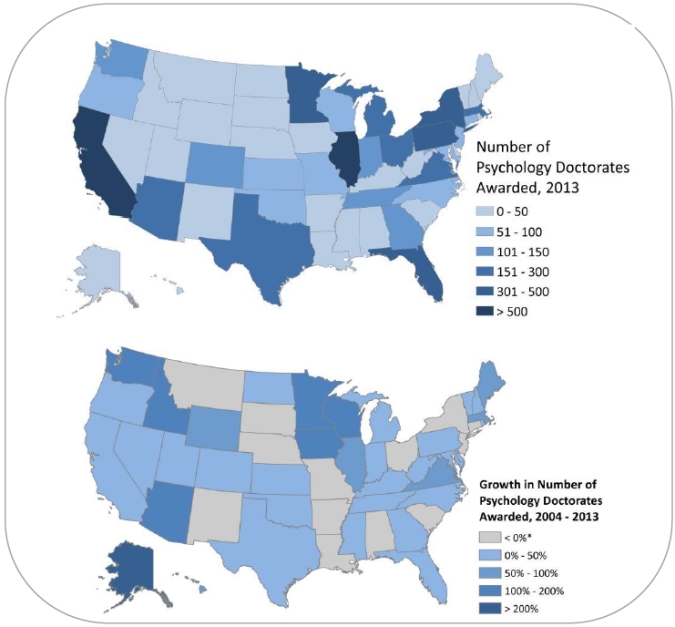
Figure 10. Number of Psychology Doctorates Awarded in 2013 by State and Percent Growth in Number of Psychology Doctorates Awarded, 2004-2013
Source: IPEDS Completions Survey (2004-2013) and IPEDS Institutional Characteristics Survey (2004-2013)
Note: States with <0% growth showed a ten-year decline in the number of psychology doctorates awarded.
Psychology Master’s Degrees Awarded by State
Figure 11opens in new window (PDF, 431KB) displays two maps, which depict the number of psychology master’s degrees awarded in 2013 broken down by state as well as the percent growth in psychology master’s degrees awarded between 2004 and 2013 for each state. In 2013, 15.1 percent of all psychology master’s degrees (4,296) were awarded by institutions in California, followed by 8.1 percent in Arizona (2,293) and 7.8 percent in Texas (2,232). The fewest psychology master’s degrees were awarded by institutions within the states of Delaware (18 or 0.06 percent), Idaho (11 or 0.04 percent), and Wyoming (five or 0.02 percent).
The greatest ten-year growth in the number of psychology master’s degrees awarded was for the state of Arizona. In 2004, 170 psychology master’s degrees were awarded by academic institutions in Arizona. By 2013, the number grew by 1,249 percent to 2,293 degrees. The second largest ten-year growth in master’s degrees awarded was for Iowa (480 percent), followed by North Dakota (325 percent). The states of Delaware, Wyoming, and Nevada showed the greatest ten-year decline in psychology master’s degrees awarded (-58 percent, -55 percent, and -51 percent respectively).14
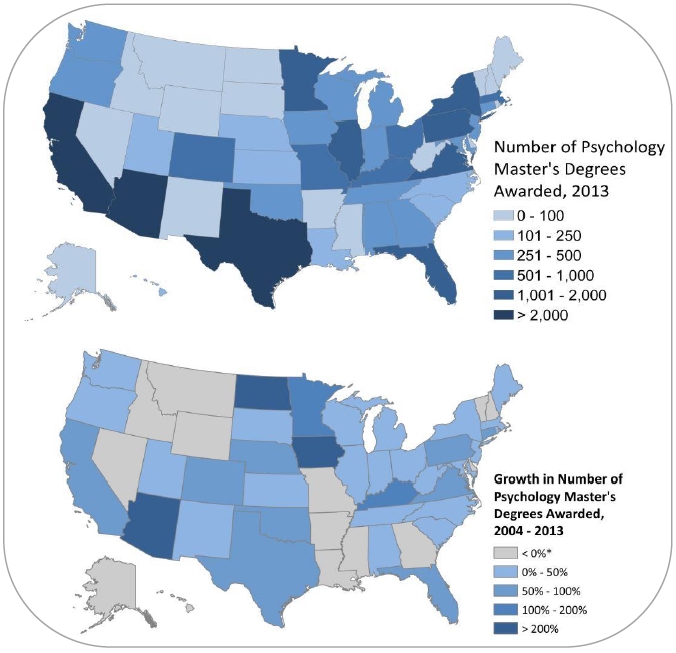
Figure 11. Number of Psychology Master’s Degrees Awarded in 2013 by State and Percent Growth in Number of Psychology Doctorates Awarded, 2004-2013
Source: IPEDS Completions Survey (2004-2013) and IPEDS Institutional Characteristics Survey (2004-2013)
Note: States with <0% growth showed a ten-year decline in the number of psychology master’s degrees awarded.
Conclusion
Data from the Integrated Postsecondary Education Data System (IPEDS) Completions Survey and IPEDS Institutional Characteristics Survey were examined to determine the number of doctoral and master’s degrees awarded in psychology during a ten-year span, ranging from 2004 to 2013. Further analyses looked at psychology graduate degrees awarded, broken down by health service provider (HSP) and research broad field, psychology subfield, type of institution (i.e., public, private not-for profit, and private for-profit), and the state in which the institution is located.
From 2004 to 2013, the number of psychology graduate degrees awarded by academic institutions in the United States increased by 32 percent for doctorates and 54 for master’s degrees. Consistently across the ten years, the largest number of psychology degrees awarded were in the subfield of clinical psychology for doctorates and in the subfield of counseling psychology for master’s degrees.
In 2013, 56 percent of all psychology doctorates and 58 percent of all psychology master’s degrees were awarded in subfields that fell under the HSP broad field. From 2004-2013, the number of psychology doctoral degrees awarded grew by 34 percent for HSP subfields. The ten-year growth for master’s degrees awarded in HSP subfields was even greater, increasing by 70 percent.
Although private not-for-profit institutions awarded the most psychology doctorates and master’s degrees in 2013, the rate of growth over ten years was greatest for private for-profit institutions. These findings may not be surprising, considering that for-profit institutions have grown significantly in number and size in recent years.
IPEDS data also revealed that in 2013, the greatest number of psychology doctorates and master’s degrees were awarded by institutions in the state of California. Approximately 18.7 percent of all psychology doctorates and 15.1 percent of all psychology masters were awarded in California. These findings are most likely due to California having the largest population and highest number of postsecondary institutions in the United States.
The findings of this report also point to directions for future research. Future reports will examine the demographic composition of psychology master’s and doctoral recipients, including their gender and race/ethnicity. In addition, future reports will examine longitudinal patterns for recipients of baccalaureate degrees in psychology.
Footnotes
1 "Academic year"refers to the period between July 1 and June 30. For example, academic year 2013 includes degrees awarded between July 1, 2012 and June 30, 2013.
2 U.S. Department of Education, National Center for Education Statistics, Integrated Postsecondary System (IPEDS). (2004-2013). Completions Surveys . [Data files and dictionaries]. Retrieved from https://nces.ed.gov/ipeds/datacenter/DataFiles.aspxopens in new window
3 U.S. Department of Education, National Center for Education Statistics, Integrated Postsecondary System (IPEDS). (2004-2013). Institutional Characteristics Surveys . [Data files and dictionaries]. Retrieved from https://nces.ed.gov/ipeds/datacenter/DataFiles.aspxopens in new window
4 For more on the Carnegie Classification system, see https://carnegieclassifications.iu.edu/lookup_listings/standard.phpopens in new window
5 The “health service providers” and “research” broad fields are distinctions made by the American Psychological Association, and not by IPEDS. Subfields classified as HSP and research can be found in Table 3 of the American Psychological Association Member Profiles: www.apa.org/workforce/publications/13-member/table-3.pdfopens in new window
6 American Psychological Association (2015). APA Member Profiles. Washington, DC: Author
7 Psychology subfields that awarded less than 40 doctorates in 2013 were excluded from this report. Also excluded was a vague subfield referred to as psychology, other. In 2013, there were 108 doctorates that fell into this subfield.
8 IPEDs defines the “Psychology, General” subfield as “a general program that focuses on the scientific study of individual and collective behavior, the physical and environmental bases of behavior, and the analysis and treatment of behavior problems and disorders. Includes instruction in the principles of the various subfields of psychology, research methods, and psychological assessment and testing methods.”
9 Due to relatively small cell sizes in the subfield of experimental psychology, this finding should be interpreted with caution.
10 Psychology subfields that awarded fewer than 200 master's degrees in 2013 were excluded from this report. Also excluded was a vague subfield referred to as psychology, other. In 2013, 2400 psychology master's degrees fell within this subfield.
11 It is difficult to determine if the large number of psychology master's degrees that fall within the subfield of counseling psychology also includes degrees awarded in counseling. "Counseling" and "counseling psychology" degrees are related, but are awarded by different programs. The possible inclusion of degrees awarded by counseling programs – not necessarily only counseling psychology programs – may contribute to this finding.
12 Due to relatively small cell sizes in the subfield of forensic psychology, this finding should be interpreted with caution.
13 Definitions for institution type can be found by searching “Control (of institution)” in the IPEDS glossary.
14
For a complete breakdown of the number of psychology doctorates and master's degrees awarded by state in 2004 and 2013, and the percent growth from 2004-2013 for each state, see Table 6 of
Appendix Bopens in new window
(PDF, 513KB).
15 U.S. Department of Education, National Center for Education Statistics. (2013). Digest of Education Statistics . Retrieved from https://nces.ed.gov/programs/digest/index.aspopens in new window
American Psychological Association. (2015). APA Member Profiles. Retrieved from https://www.apa.org/workforce/publications/15-member/table-3.pdfopens in new window (PDF, 99KB)
Knapp, L.G., Kelly-Reid, J.E., and Ginder, S.A. (2010). Postsecondary Institutions and Price of Attendance in the United States: Fall 2009, Degrees and Other Awards Conferred: 2008–09, and 12-Month Enrollment: 2008–09. Washington, DC: U.S. Department of Education, National Center for Education Statistics.
National Center for Education Statistics (NCES). Changes to IPEDS Data Collections, 2008-09. Retrieved from https://nces.ed.gov/ipeds/InsidePages/ArchivedChanges?year=2008-09
U.S. Department of Education, National Center for Education Statistics. (2013). Digest of Education Statistics. Retrieved from https://nces.ed.gov/programs/digest/index.aspopens in new window
U.S. Department of Education, National Center for Education Statistics, Integrated Postsecondary System (IPEDS). (2004-2013). Completions Surveys. [Data files and dictionaries]. Retrieved from https://nces.ed.gov/ipeds/datacenter/DataFiles.aspxopens in new window
U.S. Department of Education, National Center for Education Statistics, Integrated Postsecondary System (IPEDS). (2004-2013). Institutional Characteristics Surveys. [Data files and dictionaries]. Retrieved from https://nces.ed.gov/ipeds/datacenter/DataFiles.aspxopens in new window
- Appendix A: Technical Documentationopens in new window (PDF, 424KB)
- Appendix B: Supporting Data for Figuresopens in new window (PDF, 513KB)
- Table 1. Breakdown of Psychology Classification of Instructional Programs (CIP) into Health Service Provider and Research Broad Fieldsopens in new window (PDF, 344KB)
- Table 2. Ten-Year Growth in Number of Psychology Doctorates Awarded by Subfield, 2004-2013opens in new window (PDF, 347KB)
- Table 3. Ten-Year Growth in Number of Psychology Master's Degrees Awarded by Subfieldopens in new window, 2004-2013 (PDF, 346KB)
- Figure 1. Number of Psychology Doctorate and Master’s Degrees Awarded, 2004-2013opens in new window (PDF, 260KB)
- Figure 2. Growth in Number of Psychology Doctorates Awarded in Health Service Provider (HSP) and Research Broad Fields, 2004-2013opens in new window (PDF, 264KB)
- Figure 3. Growth in Number of Psychology Master’s Degrees Awarded in Health Service Provider (HSP) and Research Broad Fields, 2004-2013opens in new window (PDF, 264KB)
- Figure 4. Psychology Doctorates Awarded in Health Service Provider and Research Subfields, 2013opens in new window (PDF, 263KB)
- Figure 5. Number of Psychology Doctorates Awarded in Health Service Provider (HSP) and Research Subfields, 2004-2013opens in new window (PDF, 289KB)
- Figure 6. Psychology Master’s Degrees Awarded in Health Service Provider (HSP) and Research Subfields, 2013opens in new window (PDF, 265KB)
- Figure 7. Number of Psychology Master's Degrees Awarded in Health Service Provider and Research Subfields, 2004-2013opens in new window (PDF, 292KB)
- Figure 8. Growth in Number of Psychology Doctorates Awarded by Institution Type, 2004-2013opens in new window (PDF, 262KB)
- Figure 9. Growth in Number of Psychology Master's Degrees Awarded by Institution Type, 2004-2013opens in new window (PDF, 337KB)
- Figure 10. Number of Psychology Doctorates Awarded in 2013 by State and Percent Growth in Number of Psychology Doctorates Awarded, 2004-2013opens in new window (PDF, 426KB)
- Figure 11. Number of Psychology Master’s Degrees Awarded in 2013 by State,and Percent Growth in Number of Psychology Doctorates Awarded, 2004-2013opens in new window (PDF, 431KB)
Recommended citation: American Psychological Association. (2016). Psychology Master’s and Doctoral Degrees Awarded by Broad Field, Subfield, Institution Type and State (2004-2013): Findings from the Integrated Postsecondary Education Data System. Washington, DC: Author
This report describes research and analysis conducted by staff members of the American Psychological Association’s Center for Workforce Studies. It does not constitute official policy of the American Psychological Association.
The authors thank Howard Kurtzman and Jaime Diaz-Granados for valuable input on previous drafts of this report.