

Executive Summary
This report uses data from the National Science Foundation's 2013 National Survey of College Graduates (NSCG) to analyze salaries for psychologists in the United States. The data are from a nationally representative sample of full-time psychologists – those who had doctorates or professional degrees in psychology as their highest degrees, and worked at least 35 hours per week. It describes psychologists' annual salaries by geographic region, degree field, type of position, sector, as well as demographic characteristics. Major findings include:
In 2013, the median annual salary for psychologists was $80,000. More than half (57 percent) of psychologists had salaries within the range of $60,000 to $120,000. Geographically, median salaries were highest in the Middle Atlantic Division ($105,000) and lowest in the East South Central Division ($57,400). By degree field, psychologists who were trained in general psychology ($110,000) and industrial/organizational psychology ($108,000) had the highest median salaries, whereas those who were trained in educational psychology had the lowest ($78,000).
Psychologists in professional service positions had a median salary of $80,000. Among those providing professional services, self-employed psychologists in non-incorporated businesses had the highest median salary at $97,000, followed by those working in the federal government at $95,000.
Psychologists in teaching positions had a median salary of $69,000. Post-secondary teachers earned a higher median salary ($70,000) than precollege teachers ($40,000). Salary levels for teaching positions were highest in university-affiliated research institutions ($85,000).
The median salary for psychologists in research positions was $87,000. Among research positions in educational institutions, those in university-affiliated research institutions had the highest median salary at $86,500. Across sectors, salaries for research positions were highest in the private sector ($120,000).
The median salary for psychologists in management positions was $110,000. Higher salaries were found in positions directly supervising 5-20 people ($129,000), or indirectly supervising (through subordinate supervisors) more than 20 people ($155,000).
As for salary differences by demographic characteristics, salaries were generally higher for male ($90,000) than female psychologists ($75,000), and for White ($85,000) than racial/ethnic minority psychologists ($70,000). In terms of age, median salaries were highest for psychologists ages 60-64, or 30-34 years since receiving their highest degree in psychology. Salaries were also higher for psychologists with disabilities ($85,000) than those without disabilities ($80,000).
Introduction
The purpose of this report is to provide salary information for the United States psychology workforce. This report describes the median salaries for full-time psychologists by geographic region, degree field, type of position, sector, and demographic characteristics. The data analyzed in this report are from the 2013 National Survey of College Graduates conducted by the U.S. Census Bureau on behalf of the National Science Foundation's National Center for Science and Engineering Statistics (NCSES).
The National Survey of College Graduates (NCSG) is a longitudinal biennial survey of the nation's college graduates, particularly the science and engineering workforce. It uses a selected sample from the U.S. Census Bureau's American Community Survey, and includes U.S. residents under the age of 76 with at least a bachelor's degree. The 2013 NSCG has a sample size of 144,000 individuals. Due to methodological changes in the sampling procedure, data in previous years may not be comparable and were not included in this report.
The report focuses on salaries for full-time psychologists, who were operationally defined as individuals who (1) had a doctoral or professional degree in psychology as their highest degrees,1 and (2) worked at least 35 hours per week in their principle jobs (the jobs in which they worked the most hours) during the survey reference period (the week of February 1, 2013). Salaries were based on basic annual salaries2 of psychologists' principle jobs, presented in nominal dollar figures as they were reported during the survey reference period.
Section 1 of this report provides an overview of salaries for full-time psychologists and examines the distribution of salaries and salaries by geographic divisions and degree types. As psychologists work in a variety of occupations, the subsequent sections investigate salaries by different types of positions: professional service positions (Section 2), teaching positions (Section 3), research positions (Section 4), and management positions (Section 5)3 Lastly, Section 6 examines salary levels by various demographic characteristics, such as age, gender, race/ethnicity, and disability status of psychologists.
Limitations and strengths of the data presented in this report are discussed in the Conclusion. Appendix Aopens in new window (PDF, 180KB) contains technical documentation of methodology used in this report. Data supporting the figures in the report are provided in Appendix Bopens in new window (PDF, 211KB).
Section 1. Overview
According to the results based on a weighted sample of 127,000 full-time psychologists from the 2013 NSCG,4 psychologists had a median annual salary of $80,000. Figure 1opens in new window (PDF, 197KB) displays the distribution of salaries for psychologists in 2013. Although there was a wide range of salary levels, most psychologists (57.4 percent) had salaries within the range of $60,000 to $120,000. Approximately 20 percent of psychologists were paid less than $60,000, and 23 percent were paid more than $120,000..
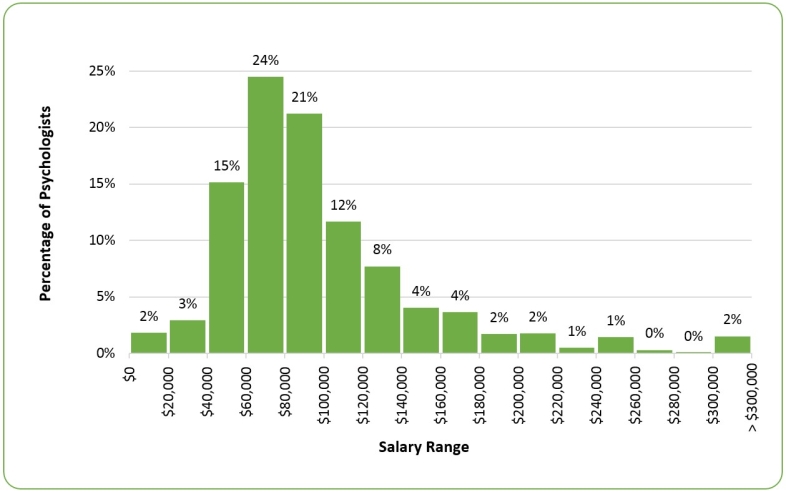
Figure 1. Salary Distribution, 2013
Notes: For data underlying this figure, please refer to Table 15 in Appendix Bopens in new window (PDF, 211KB).
Source: 2013 National Survey of College Graduates, National Science Foundation
Figure 2opens in new window (PDF, 174KB) presents the geographic variation 5 of psychologists' salaries. Salary levels were highest in the Middle Atlantic Division ($105,000), followed by the Pacific Division and the West North Central Division (both at $85,000). Salary levels were lowest in the East South Central Division ($57,400) and the South Atlantic Division ($67,000).
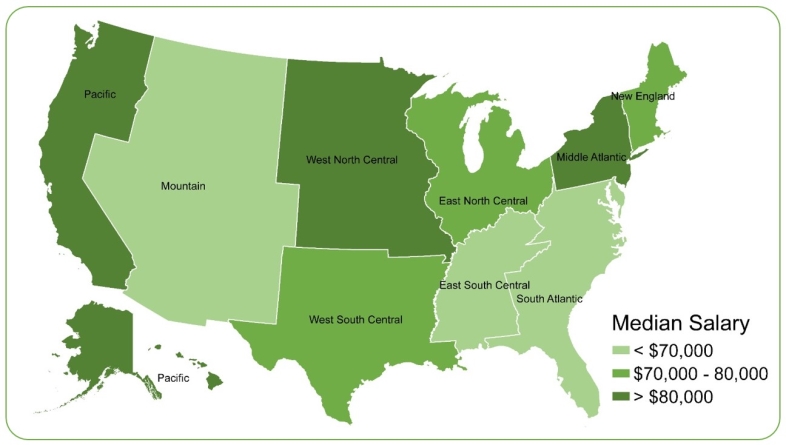
Figure 2. Median Salary by Geographic Division, 2013
Notes: For data underlying this figure, please refer to Table 16 in Appendix Bopens in new window (PDF, 211KB).
Source: 2013 National Survey of College Graduates, National Science Foundation.
Salaries by Degree
Psychologists with doctoral degrees, such as a PhD, had higher median salaries at $84,000 compared to those with professional degrees, such as a PsyD ($70,000). Table 1opens in new window (PDF, 195KB) presents summary statistics for psychologists by degree type.

Table 1. Salaries by Degree Type, 2013
Source: 2013 National Survey of College Graduates, National Science Foundation.
Figure 3opens in new window (PDF, 195KB) displays salaries by field of highest degree in psychology. The highest median salaries were found for general psychology ($110,000), followed by industrial/ organizational psychology ($108,350), experimental psychology ($95,000), and counseling psychology ($85,000). Educational psychology and social psychology had lower median salaries.
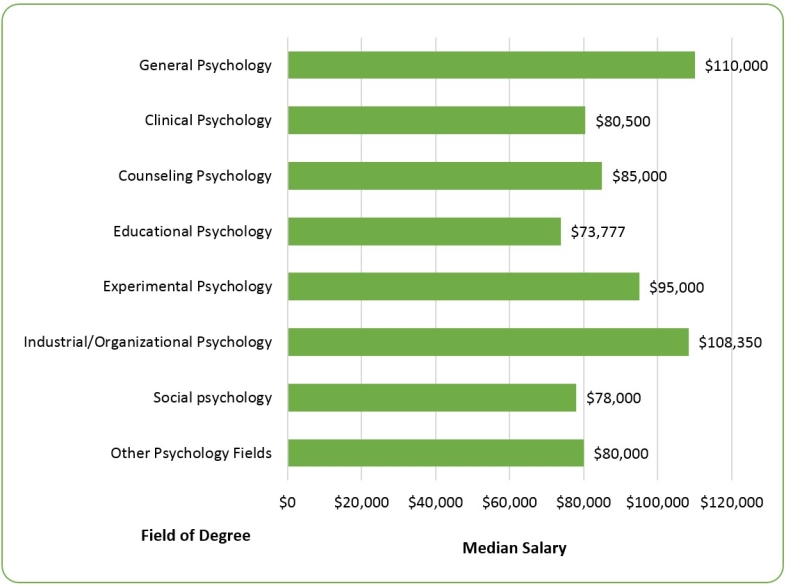
Figure 3. Median Salaries by Field of Highest Degree, 2013
Notes: For data underlying this figure, please refer to Table 17 in Appendix Bopens in new window (PDF, 211KB).
Source: 2013 National Survey of College Graduates, National Science Foundation.
As psychologists work in a variety of positions, the following four sections present salaries in five mutually exclusive types of positions (i.e., professional service, teaching, research, and management positions). Types of positions were determined based on the primary work activity (the activity in which the individual worked the most hours) at the principle job. Table 2opens in new window (PDF, 186KB) provides a complete list of position types and their corresponding work activities.
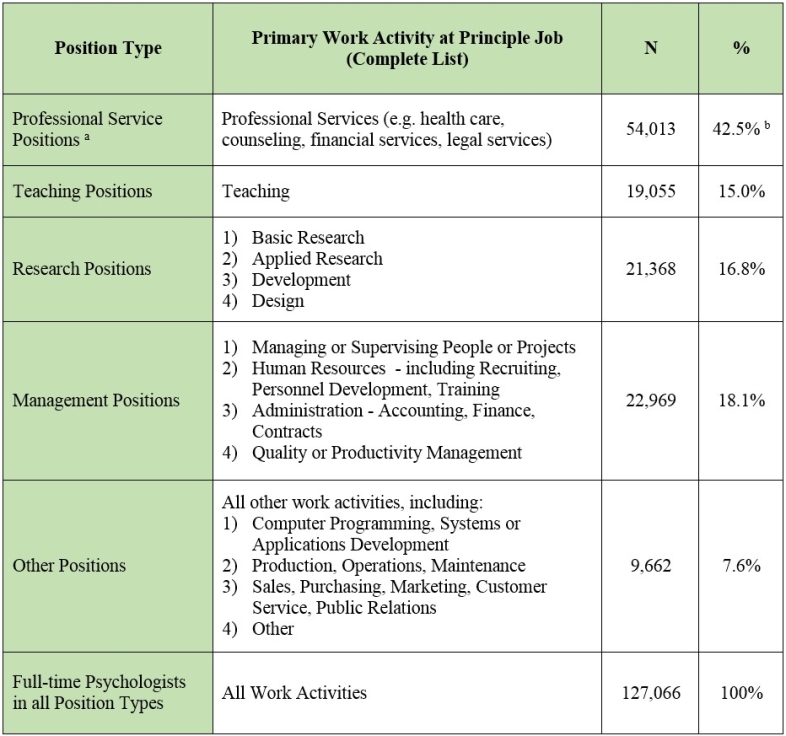
Table 2. Definition of Position Types
Note: Total may not sum to 100 percent due to rounding.
a. Professional service positions roughly represent psychologists providing health services, but may include positions that provide other services such as financial and legal services.
b. According to the state licensing board lists, there were approximately 106,000 licensed psychologists (compiled and estimated by the American Psychological Association, 2016). The estimated number of psychologists in professional service positions (as well as in other types of positions) was lower because the estimation in this report was based on psychologists' primary work activity in their full-time principle jobs. Psychologists often work in multiple positions and may choose to work part-time in their principle jobs. One position may also involve multiple work activities.
Source: 2013 National Survey of College Graduates, National Science Foundation.
Section 2. Professional Service Positions
Table 3opens in new window (PDF, 210KB) summarizes salaries for professional service positions by sector. 6 Across all sectors, salary levels were highest for self-employed psychologists (non-incorporated), followed by those working in the federal government. In educational institutions, salary levels were higher in public institutions than in private institutions. In the private sector, those providing services in non-profit organizations had higher salary levels than those employed in for-profit organizations. Collapsed across all sectors, median salary for psychologists providing professional services was $80,000.
In terms of salary variation, Table 3opens in new window (PDF, 210KB) indicates that professional service positions in the government had a narrower range of salary levels (with the lowest standard deviations) compared to those in other sectors. Salaries for self-employed psychologists had the highest standard deviation, indicating high salary variations, especially for those working in incorporated businesses.
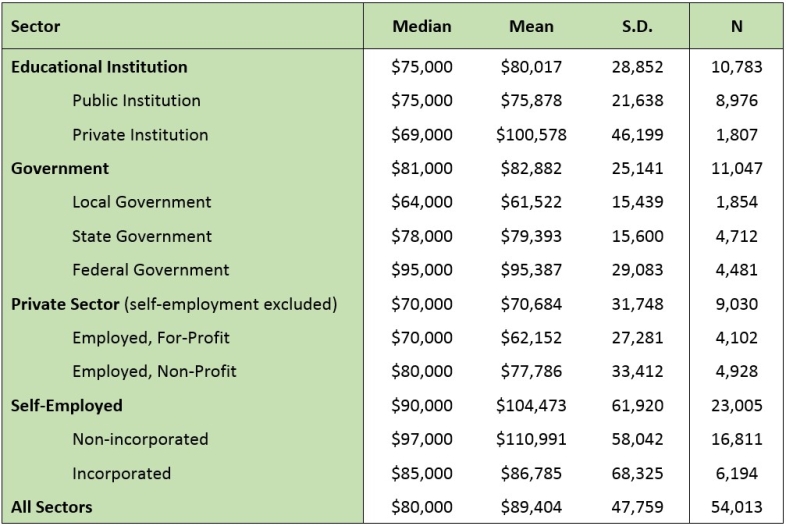
Table 3. Salaries for Professional Service Positions, by Sector, 2013
Source: 2013 National Survey of College Graduates, National Science Foundation.
Per availability of NSCG reported variables, the following sections examine salaries for professional service positions in some sectors: 1) those in the private sector (self-employment excluded), 2) those who were self-employed, and 3) those in educational institutions.
1) Professional Service Positions in the Private Sector
Table 4opens in new window (PDF, 314KB) presents salaries by employer size in the private sector (self-employment excluded). For the for-profit sector, the highest median salary ($80,000) was found in companies or organizations with 11-99 employees. For the non-profit sector, salaries were highest in organizations with 100-999 employees ($83,000).
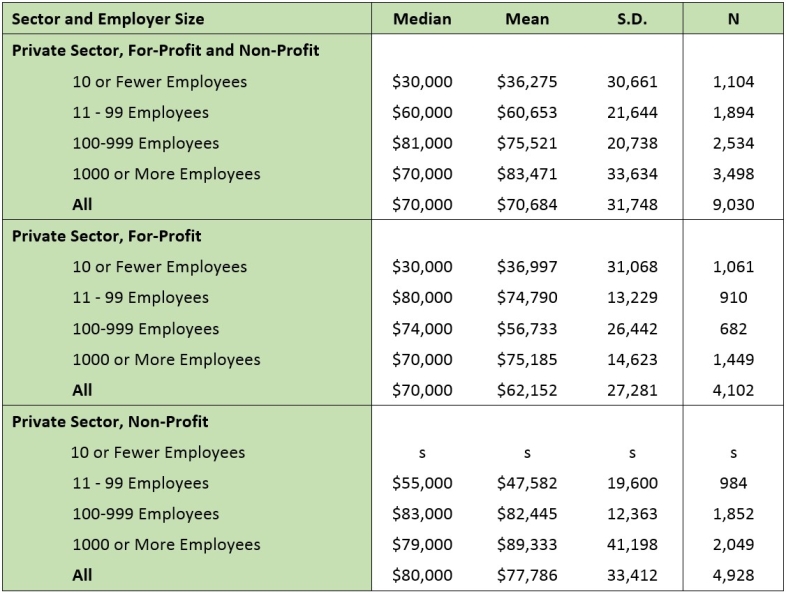
Table 4. Salaries for Professional Service Positions in the Private Sector, by Employer Size, 2013
s = suppressed due to small cell size.
Source: 2013 National Survey of College Graduates, National Science Foundation.
2) Self-employed Psychologists Providing Professional Services
Table 5opens in new window (PDF, 197KB) shows salary levels by years since the start of the business for self-employed psychologists. The median salary was lowest ($75,000) for new business owners (i.e., within ten years since the start of business) and highest ($97,000) for owners of businesses that had existed 21-30 years.
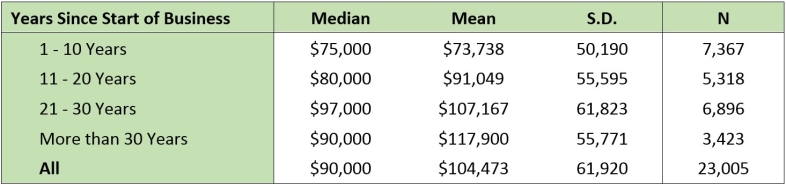
Table 5. Salaries for Self-employed Psychologists in Professional Service Positions, by Years since Start of Business, 2013
Source: 2013 National Survey of College Graduates, National Science Foundation.
3) Professional Service Positions in Educational Institutions
For psychologists providing services in educational institutions7 (Table 6opens in new window (PDF, 298KB)), the median salary was highest in medical schools ($120,000) and lowest in 4-year colleges ($66,000).
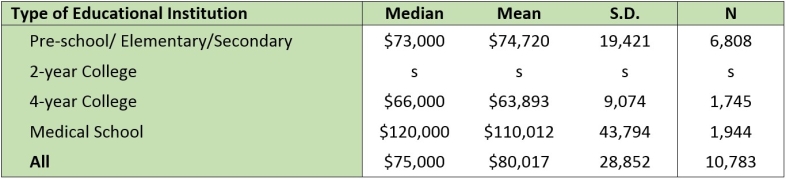
Table 6. Salaries for Professional Service Positions in Educational Institutions, by Type of Educational Institution, 2013
s = suppressed due to small cell size.
Note: Salaries for professional service positions in university-affiliated research institutions were not reported in this table as no observation was found for this category in the survey sample.
Source: 2013 National Survey of College Graduates, National Science Foundation.
Section 3. Teaching Positions
Compared to professional service positions, psychologists in teaching positions had a lower median salary at $69,000.8 Table 7opens in new window (PDF, 200KB) displays salary levels for psychologists in teaching positions. Of all teaching positions, salaries were lowest for precollege teachers, with a median salary of $40,000. For post-secondary teachers, salaries were lower for those teaching in the education discipline ($62,000) compared to those teaching in the psychology discipline ($70,000) or other disciplines (health-related sciences, business administration, etc.) at $95,000.
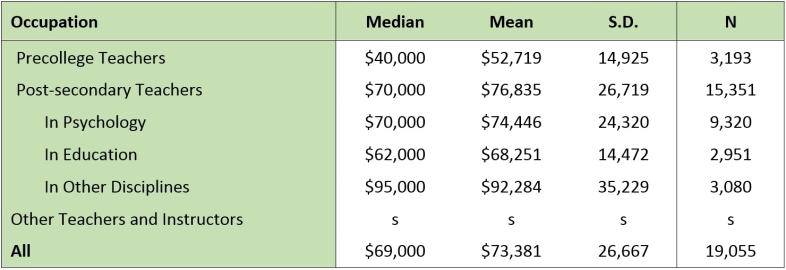
Table 7. Salaries for Teaching Positions, by Occupation, 2013
s = suppressed due to small cell size.
Source: 2013 National Survey of College Graduates, National Science Foundation.
Most teaching positions (97.3 percent) were within educational institutions. Table 8opens in new window (PDF, 205KB) presents salaries in teaching positions by sector and type of educational institution. Psychologists employed in teaching positions at private educational institutions ($70,000) were paid more than those in public educational institutions ($66,000). Median salary was also higher for teachers in university-affiliated research institutions ($85,000) than in other types of educational institutions.
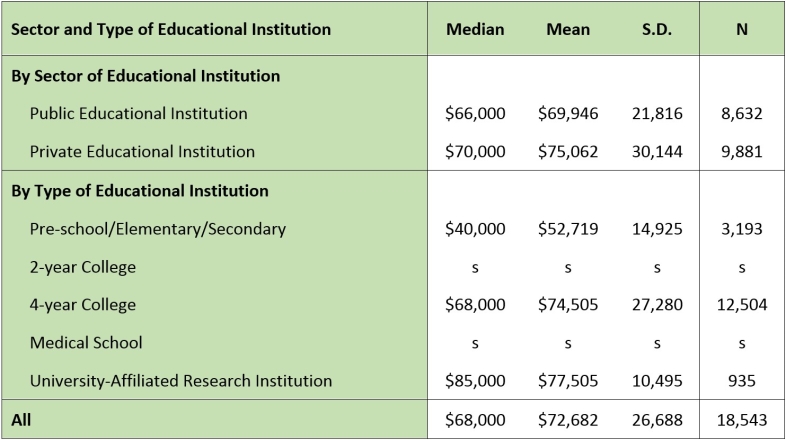
Table 8. Salaries for Teaching Positions, by Sector and Type of Educational Institution, 2013
s = suppressed due to small cell size.
Note: Teaching positions in non-educational institutions were not included in this table.
Source: 2013 National Survey of College Graduates, National Science Foundation.
Section 4. Research Positions
Median salaries for psychologists in research positions were generally higher ($87,000) compared to professional service and teaching positions. Table 9opens in new window (PDF, 299KB) displays salary levels for research positions broken down by type of research activity. Psychologists who conducted development research activity had the highest median salary at $92,000.
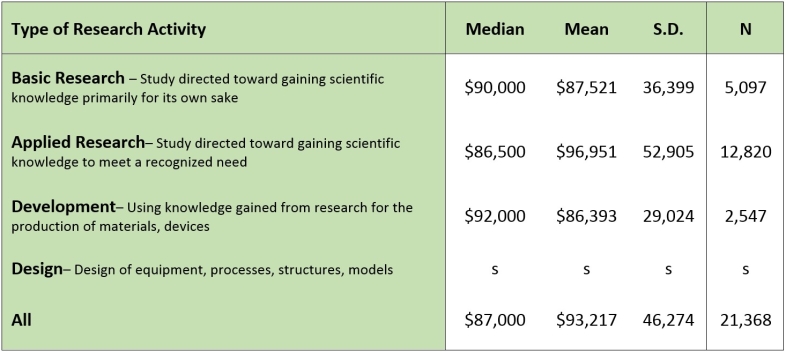
Table 9. Salaries for Research Positions, by Type of Research Activity, 2013
s = suppressed due to small cell size.
Source: 2013 National Survey of College Graduates, National Science Foundation.
Most research positions (56.1 percent) were within educational institutions, with salary levels presented in Table 10opens in new window (PDF, 298KB). The highest median salaries were found for university-affiliated research institutions ($86,500), followed by 4-year colleges ($75,000).
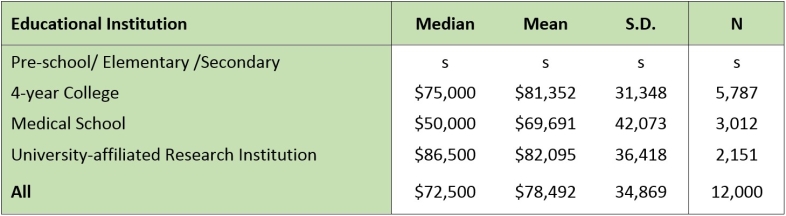
Table 10. Salaries for Research Positions, by Type of Educational Institution, 2013
s = suppressed due to small cell size.
Note: Salaries for research positions in 2-year colleges were not included in this table as no observations were found for this category in the survey sample.
Source: 2013 National Survey of College Graduates, National Science Foundation.
Table 11opens in new window (PDF, 306KB) presents salaries for research positions by sector. The highest-paid research positions were in the private sector, especially in the non-profit sector at $130,000. For psychologists with research positions in educational institutions, those in public institutions had higher salary levels than those in private institutions.
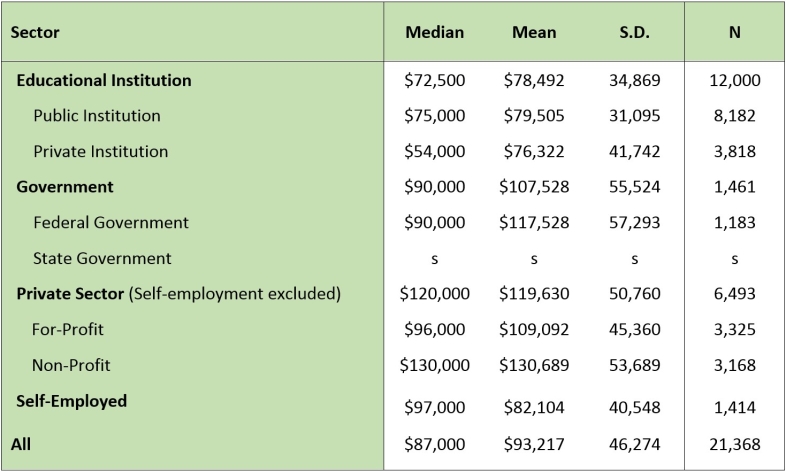
Table 11. Salaries for Research Positions, by Sector, 2013
s = suppressed due to small cell size.
Note: Salaries for research positions in local government were not included in the table as no observation was found for this category in the survey sample.
Source: 2013 National Survey of College Graduates, National Science Foundation.
Section 5. Management Positions
Among all position types, management positions had the highest median salary at $110,000. Table 12opens in new window (PDF, 207KB) presents salary levels for management positions by sector. The highest salary levels were found in the private sector, especially within the private for-profit sector ($155,000). However, the large standard deviation (SD=186,239) suggests high salary variations within this sector.
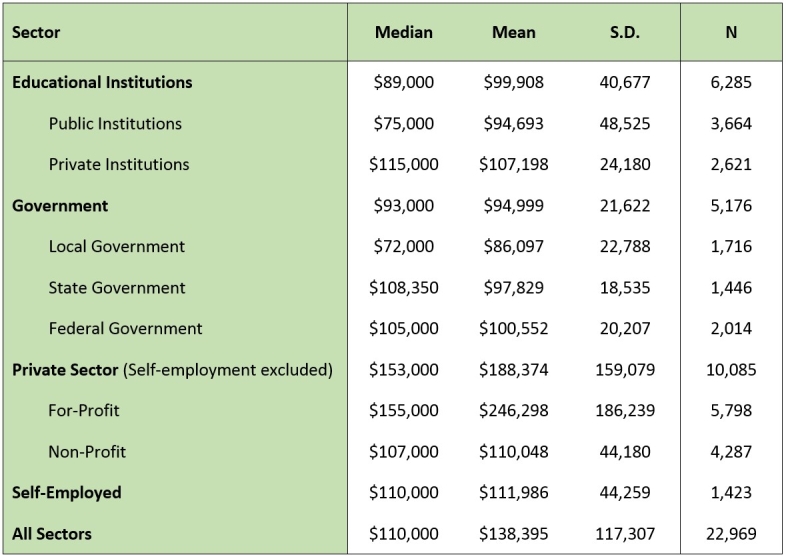
Table 12. Salaries for Management Positions, by Sector, 2013
Source: 2013 National Survey of College Graduates, National Science Foundation.
Salary levels in management positions differed by the number of people under supervision (Table 13opens in new window (PDF, 278KB)). Higher salary levels were found for positions where respondents were responsible for directly supervising 5-20 people ($129,000), or indirectly supervising (through subordinate supervisors) more than 20 people ($155,000).
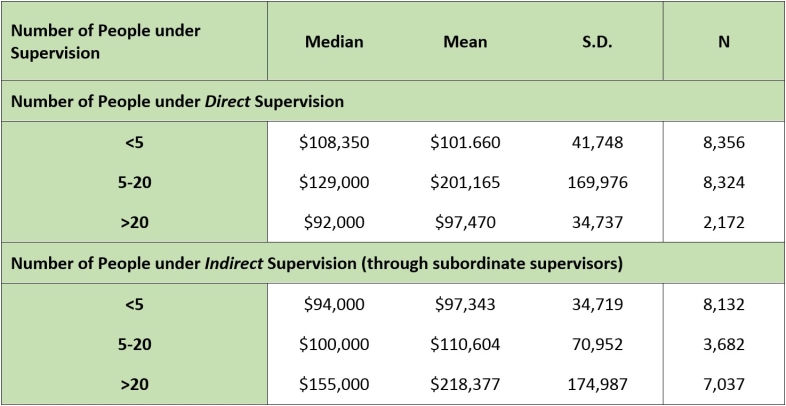
Table 13. Salaries for Management Positions, by Number of People under Supervision, 2013
Source: 2013 National Survey of College Graduates, National Science Foundation.
Section 6. Salaries by Demographic Characteristics
This section examines full-time psychologists' salaries by gender, race/ethnicity, age, and disability status.9
Figure 4opens in new window (PDF, 264KB) displays psychologists' salaries by gender and racial/ethnic groups. Median salaries were higher for male psychologists ($90,000) compared to female psychologists ($75,000), and for White psychologists ($85,000) compared to racial/ethnic minority psychologists ($70,000).
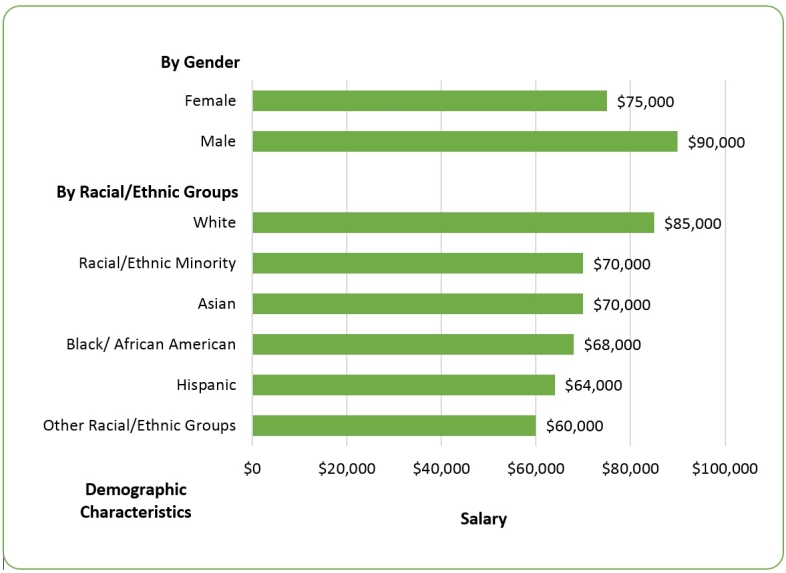
Figure 4. Median Salary by Gender and Racial/Ethnic Groups, 2013
Note: "Racial/ethnic minority" includes Asian, Black/African Americans, Hispanics, and other racial/ethnic groups. For data underlying this figure, please refer to Table 18 in Appendix B.
Source: 2013 National Survey of College Graduates, National Science Foundation.
Salaries were generally higher for older psychologists. Figure 5 displays psychologists' salaries by age group. Median salaries were highest for psychologists ages 60-64 ($97,000). Similar patterns were found with salaries by years since highest degree (see Table 18 in Appendix Bopens in new window (PDF, 211KB)). Median salaries were highest for psychologists who received their highest degrees 30-34 years earlier ($110,000).
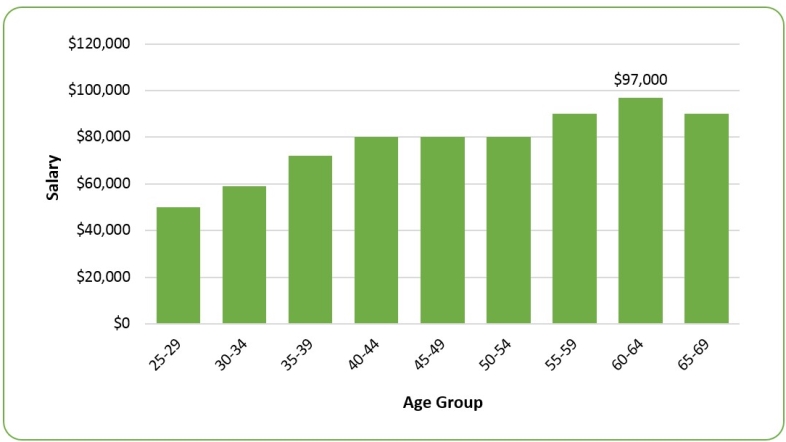
Figure 5. Median Salary by Age Group and by Years since Highest Degree, 2013
Note: For data underlying this figure, please refer to Table 18 in Appendix B.
Source: 2013 National Survey of College Graduates, National Science Foundation.
As for salaries by disability status, psychologists with disabilities had a median salary of $85,000, compared to psychologists with no disabilities10 at $80,000. Among psychologists with disabilities (Table 14opens in new window (PDF, 198KB)), those with difficulty seeing had the highest median salary level at $92,000, followed by those with hearing disabilities at $85,000.
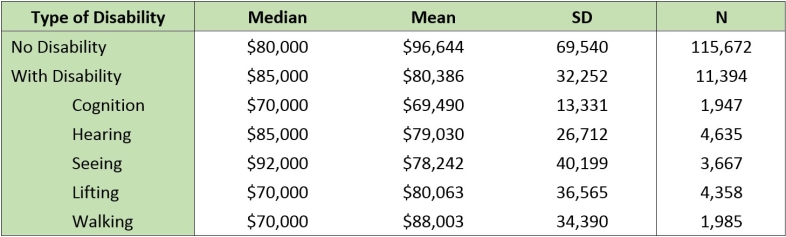
Table 14. Salaries by Type of Disability, 2013
Source: 2013 National Survey of College Graduates, National Science Foundation.
Conclusion
The report uses data from the National Science Foundation's 2013 National Survey of College Graduates (NSCG) to analyze salaries for psychologists. Psychologists' salary levels were highest in the Middle Atlantic Division and lowest in the East South Central Division. Psychologists in management positions had the highest median salary, followed by those in research, professional service, and teaching positions. Salary levels were generally higher for male than for female psychologists, for White than for racial/ethnic minority psychologists, and for older than for younger psychologists.One limitation of this report is that, because of recent changes in the NSCG methodology, trends in psychologists' salaries could not be determined. However, given that the 2015 NSCG used the same sampling method as the 2013 survey, future reports can begin to identify changes over time.
Another limitation is that, although the NSCG collects specific industry information about respondents' employers, that information is not included in the data files made available to the public. Having more detailed industry information about employers – within the domains of healthcare, social assistance, public administration, education, etc. – would enrich our understanding of the work settings of psychologists and the salaries associated with those settings.
In contrast, the strength of using NSCG data comes from its large and nationally representative sample drawn from the American Community Survey and its detailed breakdown of degree type and major field. These features make it possible to capture patterns in salaries for all individuals with doctoral-level degrees in psychology, including PsyD degrees. The NSCG is one of the most useful data sources for understanding the nation's psychology workforce.
Footnotes
1 NSCG categorizes degree type into four categories: bachelor's, master's, doctorate, and professional degrees. Although PhDs and PsyDs are both doctoral-level degrees, the NCSES codes psychology PhDs as "doctorates" and PsyDs as "professional degrees." (NCSES, personal communications, May 12, 2016). In this report, psychologists were defined on the basis of degree attainment, not on reported occupation. For detailed documentation on how full-time psychologists were defined, please refer to Appendix A.
2 Basic annual salaries do not include bonuses, overtime, or additional compensation for summertime teaching or research. Different variables were used in the analysis of salaries per availability of NSCG reported variables, and as sample size allowed. Throughout the report, cells with sample sizes of less than four were suppressed. 3 Position types were determined by survey respondents' reported work activities. See detailed documentation on position types in Table 2
3 Position types were determined by survey respondents' reported work activities. See detailed documentation on position types in Table 2.
4 According to the 2013 NSCG, there were 221,000 individuals who had doctorates or professional degrees in psychology as their highest degrees. Approximately 37,000 were not working during the survey reference period: 2,000 were unemployed and 35,000 were not in labor force, e.g., retired, student, or did not want to work. Approximately 57,000 were working part-time (less than 35 hours per week) in their principle jobs.
5 Geographic Divisions were those used by the U.S. Census Bureau. See Appendix A for detailed documentation.
6 Sector categories are mutually exclusive. Self-employment included those self-employed and business owners in incorporated or non-incorporated businesses, professional practices, or farms. For detailed documentation on sector, please refer to Appendix A opens in new window (PDF, 180KB).
7 Educational institutions were coded into five categories as follows: Pre-school/Elementary/Secondary, 2-year College, 4-year College, Medical School, and University-Affiliated Research Institution. See detailed documentation in Appendix A opens in new window (PDF, 180KB).
8 For a more detailed report on psychology faculty salary, please refer to 2014-15: Psychology Faculty Salaries (American Psychological Association, 2015).
9 For detailed documentation on these demographic variables please refer to Appendix A opens in new window (PDF, 180KB).
10 NSCG categorized disability into five types: seeing, hearing, walking, lifting, and cognitive disabilities. Please refer to Appendix Aopens in new window (PDF, 180KB) for detailed documentation on the disability variable.
American Psychological Association. (2016). County-Level Analysis of U.S. Licensed Psychologists and Health Indicators. Retrieved from https://www.apa.org/workforce/publications/15-county-analysis/index
American Psychological Association (2015). Psychology faculty salaries for the 2014-2015 academic year: Results from the 2015 CUPA-HR survey for four-year colleges and universities. Retrieved from https://www.apa.org/workforce/publications/15-cupa-hr/index
National Science Foundation, National Center for Science and Engineering Statistics. (2013). National Survey of College Graduates Public Use Microdata File and Codebook.
- Appendix A: Technical Documentationopens in new window (PDF, 180KB)
- Appendix B: Data underlying Figuresopens in new window (PDF, 211KB)
- Table 1: Salaries by Degree Type, 2013opens in new window (PDF, 195KB)
- Table 2: Definition of Position Typesopens in new window (PDF, 186KB)
- Table 3: Salaries for Professional Service Positions, by Sector, 2013opens in new window (PDF, 210KB)
- Table 4: Salaries for Professional Service Positions in the Private Sector, by Employer Size, 2013opens in new window (PDF, 314KB)
- Table 5: Salaries for Self-employed Psychologists in Professional Service Positions, by Years since Start of Business, 2013opens in new window (PDF, 197KB)
- Table 6: Salaries for Professional Service Positions in Educational Institutions, by Type of Educational Institution, 2013opens in new window (PDF, 298KB)
- Table 7: Salaries for Teaching Positions by Occupation, 2013opens in new window (PDF, 200KB)
- Table 8: Salaries for Teaching Positions, by Sector and Type of Educational Institution, 2013opens in new window (PDF, 205KB)
- Table 9: Salaries for Research Positions, by Type of Research Activity, 2013opens in new window (PDF, 299KB)
- Table 10: Salaries for Research Positions, by Type of Educational Institution, 2013opens in new window (PDF, 298KB)
- Table 11: Salaries for Research Positions, by Sector, 2013opens in new window (PDF, 306KB)
- Table 12: Salaries for Management Positions, by Sector, 2013opens in new window (PDF, 207KB)
- Table 13: Salaries for Management Positions, by Number of People under Supervision, 2013opens in new window (PDF, 278KB)
- Table 14: Salaries by Type of Disability, 2013opens in new window (PDF, 198KB)
- Figure 1: Salaries Distribution, 2013 opens in new window(PDF, 197KB)
- Figure 2: Median Salary by Geographic Division, 2013opens in new window (PDF, 174KB)
- Figure 3: Median Salary by Field of Degree, 2013opens in new window (PDF, 195KB)
- Figure 4: Median Salary by Gender and Racial/Ethnic Groups, 2013opens in new window (PDF, 264KB)
- Figure 5: Median Salary by Age Group, 2013opens in new window (PDF, 249KB)
Recommended citation: American Psychological Association. (2016). Salaries in psychology: findings from the National Science Foundation’s 2013 National Survey of College Graduates. Washington, DC: Author.
This report describes research and analysis conducted by staff members of the American Psychological Association’s Center for Workforce Studies. It does not constitute official policy of the American Psychological Association.
The use of data from the National Science Foundation does not imply NSF endorsement of the research, research methods or conclusions contained in this report.
The authors thank Howard Kurtzman and Jaime Diaz-Granados for valuable input on previous drafts of this report.